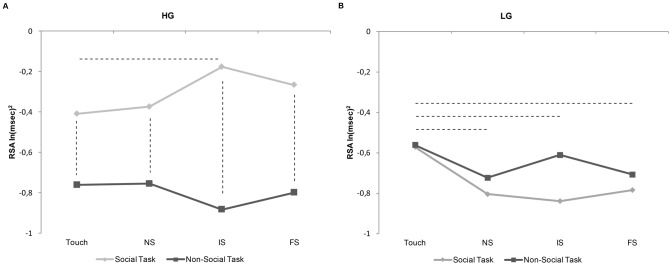
Figure 5. RSA response of High and Low interoception Groups as a function of distances in Social and Non-Social Task.

(A) RSA response of the High interoception Group to each experimental condition in the Social (light gray line) and the Non-Social Task (dark gray line). (B) RSA response of the Low interoception Group to each experimental conditions in the Social (light gray line) and the Non-Social Task (dark gray line). NS = Near-peripersonal Space; IS = Intermediate-Peripersonal Space; FS = Far-peripersonal Space; HG = High interoception Group; LG = Low interoception Group. Dashed line indicates p<0.05. See Table 2 for standard deviations.
