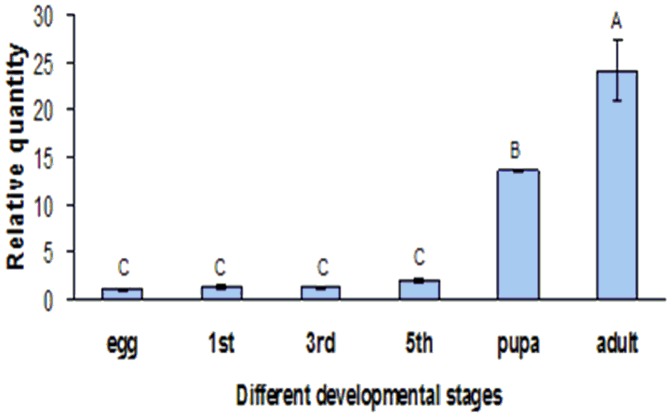
Figure 5. The relative expression levels of OfRyR in different developmental stages of O. furnacalis.
Data were presented as means ± SE for four independent replicates. 1st, 3rd and 5th denotes first-instar, third-instar and fifth-instar larva. Different letters above each bar indicate statistical difference by ANOVA followed by the Duncan's Multiple Comparison test (P<0.05).

