
Figure 3. Distribution of Pavlovian conditioned approach index scores between vendors.
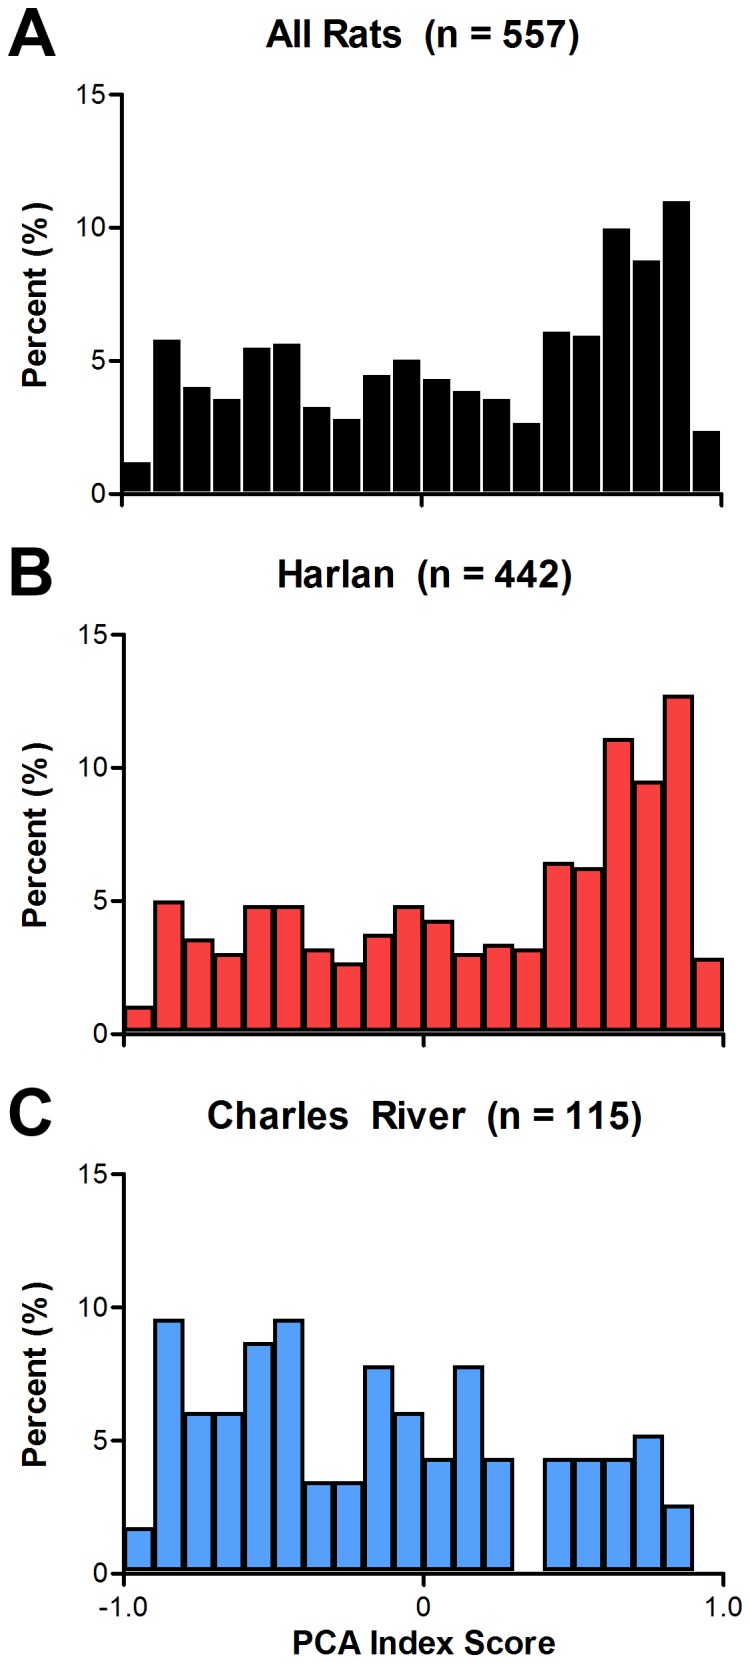
The percent distribution of PCA scores, averaged from the last two sessions of training, of (A) all rats as well as the total sample subdivided into rats acquired from (B) Harlan (n = 442) or (C) Charles River (n = 115). Rats are binned by PCA score (−1.0 to +1.0) in increments of 0.10.