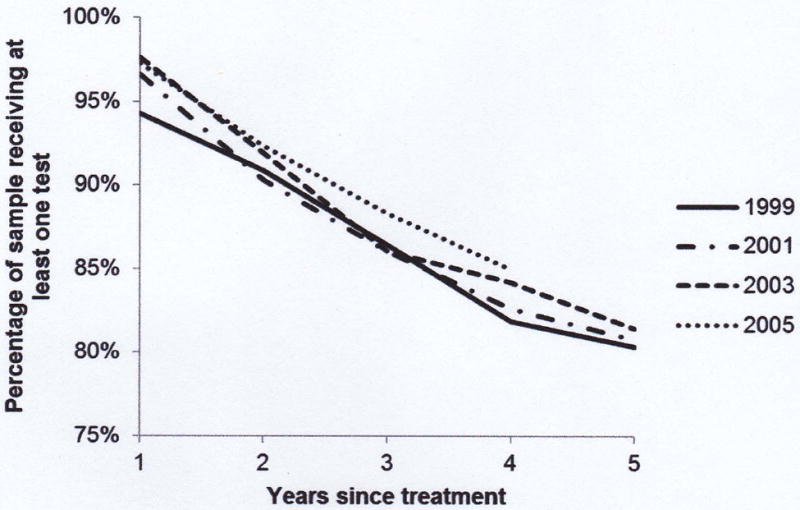
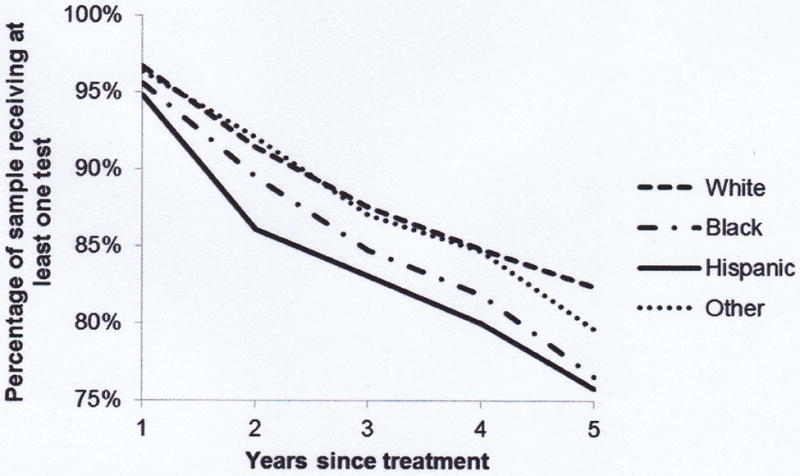
Figure 2.


- Selected Year of Diagnosis
- Race/ethnicity
Figures show the percentage of the sample receiving at least one prostate-specific antigen test in each year following initial treatment. In Figure 2(a) the sample is separated by year of diagnosis (for selected years) and in Figure 2(b) the sample is divided by race/ethnicity.
