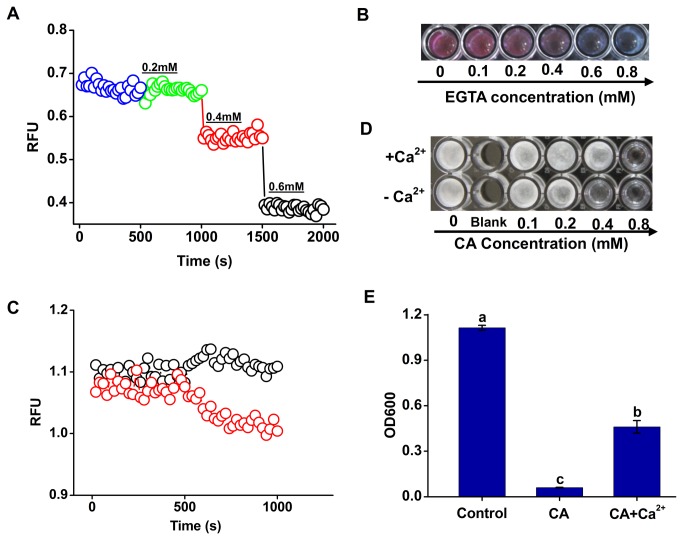
Figure 4. Involvement of Ca2+ efflux in the growth inhibition of P . capsici zoospores by CA.
(A) Effects of Specific Ca2+ chelant EGTA on the the cytosolic Ca2+ content. A quantity of EGTA was added into the well every 8 min and its concentration arrived at 0.2, 0.4, and 0.6 mM respectively. A representative trace of three repeats of each experiment was shown. (B) Zoospore vitality of P . capsici exposed to EGTA at the given concentrations for 8 h. (C) Changes of CA-induced Ca2+ efflux in response to the addition of exogenous Ca2+. Red “○”, only CA was added at 8 min post incubation to a final concentration of 0.4 mM respectively; Black “○”, CaCl2 was added to a final concentration of 1.5 mM before the addition of CA at 8 min post incubation, and then the following operation was the same to the former. A representative trace of three repeats of each experiment was shown. (D) Mycelial formation from zoospores exposed to CA and CA+Ca2+ for 48 h. The results shown were obtained from one of three independent experiments. (E) Optical density at 600 nm (OD600) resulted from the growth of P . capsici . The addition of Ca2+ significantly reduced the growth inhibition of P . capsici by CA (P<0.05).

