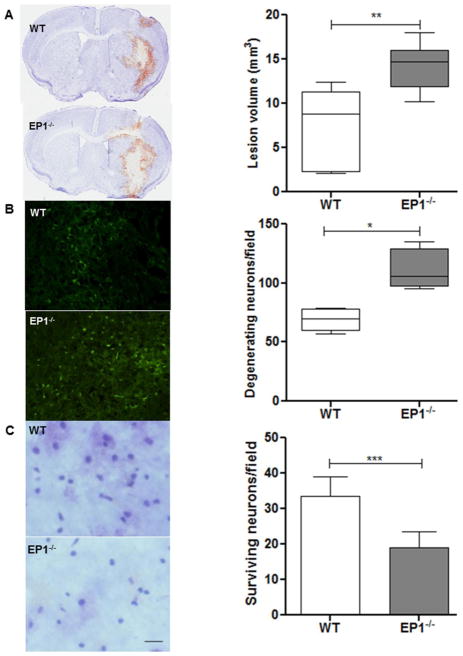
Fig 2.
Deletion of EP1 receptor increases brain injury volume, cell death, and reduced cell survival. (A) Representative photomicrograph showing brain sections from EP1−/− and WT mice subjected to ICH injury. Quantification showed significantly larger brain injury volume in EP1−/− compared to WT mice at 72 h after ICH injury (P<0.01; n=6). (B) Fluoro-Jade B staining photomicrograph and quantification showed a significant increase in degenerating neurons in EP1−/− compared to WT mice following 72 h ICH (P<0.02; n = 4). (C) Representative image and quantitative analysis of the surviving neurons with Cresyl Violet staining showed significantly more surviving neurons in the peri-hematoma region of WT compared to the EP1−/− mice at 72 h post ICH (P<0.001; n=4). Values are expressed as mean ± S.D.

