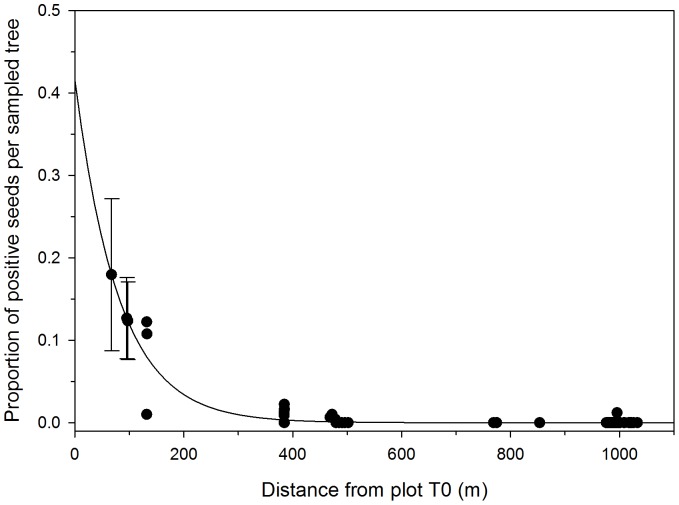
Figure 3. Estimates of the proportion of positive seeds per sampled tree for the 52 sampled tree locations outside of the GE plot (Plot T0) from 2000–2010, based on the fit of the exponential dispersal model to the data.
Predictions and 95% prediction intervals are shown for the three tree locations surveyed in plot T0 (distances of 67, 95, and 97 m).

