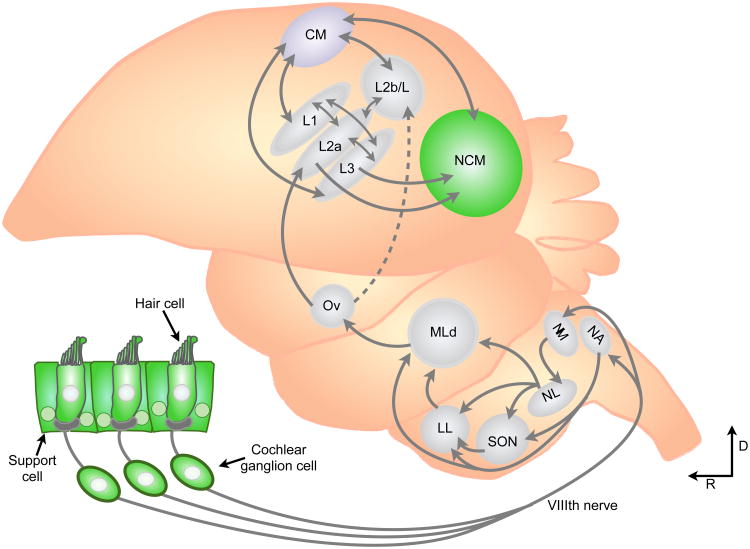
Figure 2. Distribution of ERs in the songbird ascending auditory system.
The dashed line connecting Ov to L2b indicates that this projection is a smaller input than the one to L2a, and its origin is restricted to the medial portion of Ov. Areas in green indicate sites of known ER expression in songbirds. Note that portions of this schematic have been simplified for clarity. L1, L2a, L2b/L and L3 refer to individual subregions in the field L complex. NA nucleus angularis; NM, nucleus magnocellularis; SON, superior olivary nucleus; NL, nucleus laminaris; LL, lateral lemniscus; MLd, mesencephalicus pars dorsalis; Ov, ovidalis; CM, caudal mesopallium; NCM, caudomedial nidopallium; D, dorsal; R, rostral.

