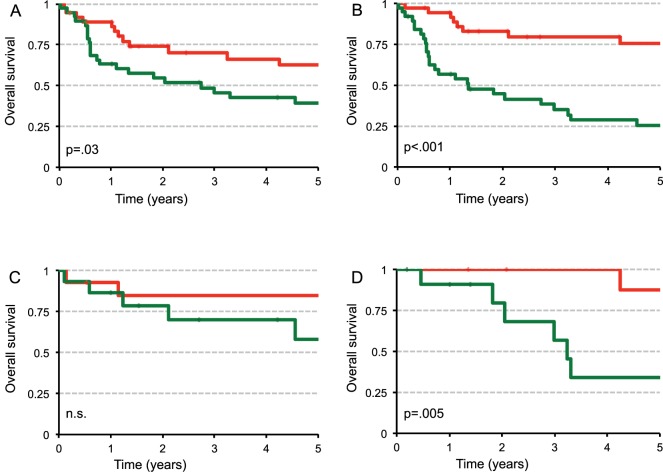
Figure 2. Patients with CIP2A high mRNA expression have an overall lower survival rate than patients with CIP2A low mRNA expression.
The graphs show Kaplan–Meier curves of OS according to CIP2A mRNA expression. (red: CIP2A mRNA expression below median fold expression value of 10,5 above normal tissue), green: CIP2A mRNA expression above median fold expression value of 10,5 above normal tissue) (A & B) All patients with respect to CIP2A mRNA expression normalized to housekeeping gene (n = 75) (A: b2MG; B: GAPDH) (C) Patients in Stage UICC II with respect to CIP2A mRNA expression normalized to housekeeping gene GAPDH (n = 29) (D) Patients in Stage UICC III with respect to CIP2A mRNA expression normalized to housekeeping gene GAPDH (n = 21).

