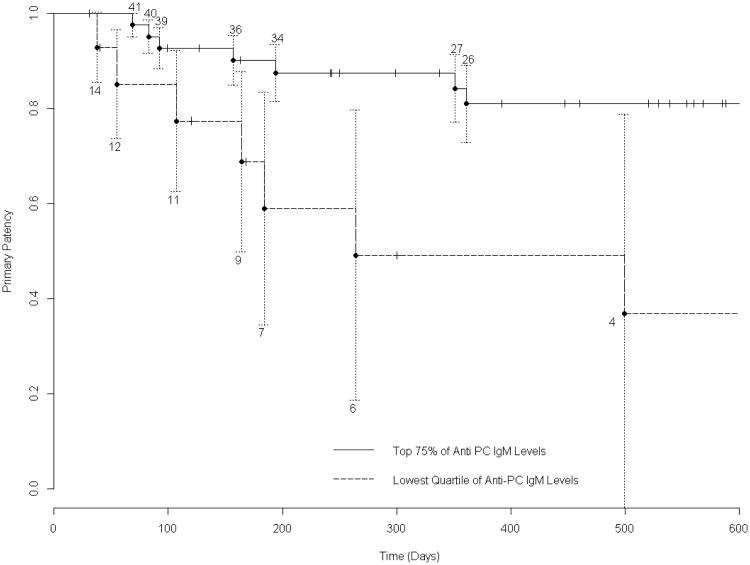
Figure 2. Kaplan-Meier Survival Analysis of Overall Primary Graft Patency According to IgM Level.
The difference in primary graft patency (stenosis requiring intervention, and graft occlusion) between those in the bottom quartile of anti-PC IgM values, and those in the top 75% was significant (p=.0085 log-rank test). The numbers above and below the graph lines indicate the number of subjects at risk at each interval. SEM's are shown, with truncation of the graph to 600 days, where the SEM of the primary group exceeds 10%.

