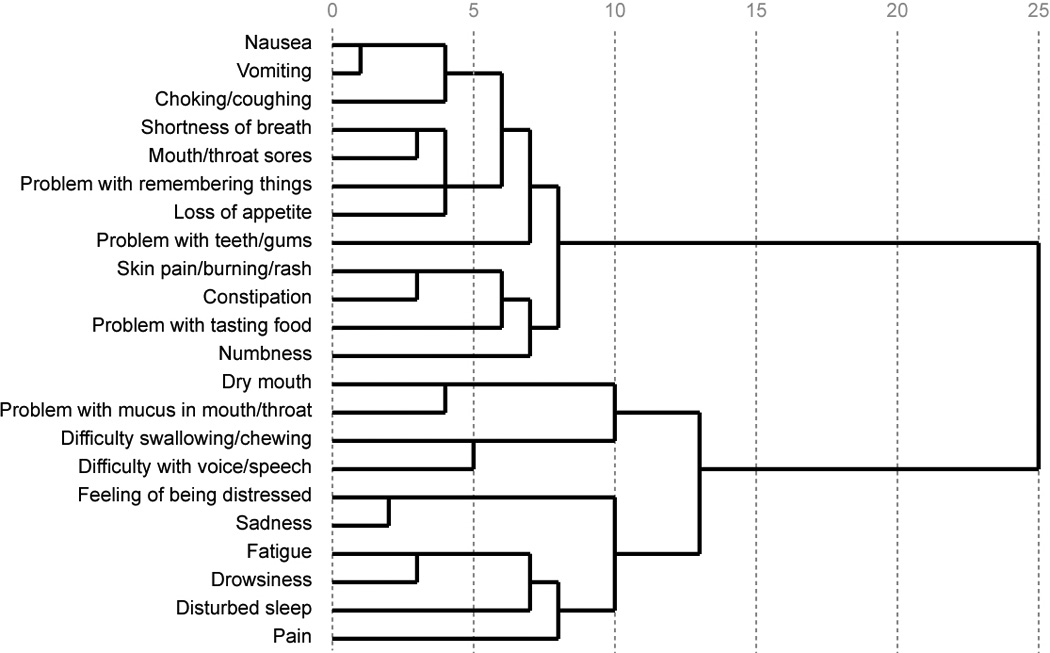
Figure. 4.

Dendrogram of symptom cluster analysis. Looking at the figure from left to right, the items will join together. The items that join with others sooner along the relative distance scale of 0–25 (more to the left in the figure) were rated by patients more similarly. For example, it can be seen that the items ‘nausea’ and ’vomiting’ join together very quickly suggesting that patients perceived and rated these items similarly.
