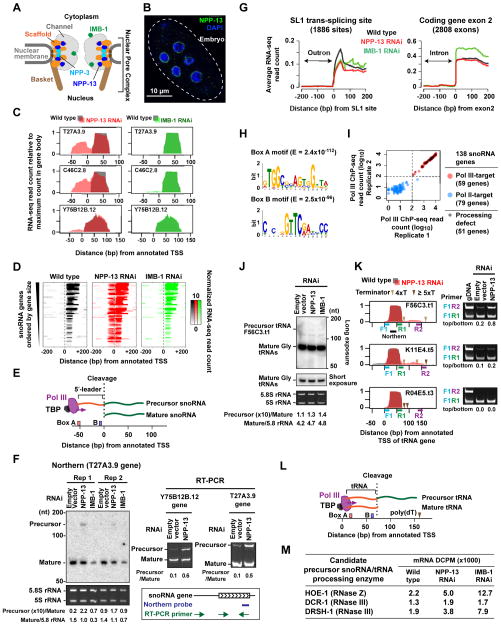
Figure 1. NPP-13 is required for snoRNA and tRNA processing.
(A) Schematic of the C. elegans nuclear pore. The locations of nucleoporins studied are indicated, based on the yeast nuclear pore structure (Alber et al., 2007).
(B) Immunofluorescence of NPP-13 in C. elegans embryos.
(C) RNA-seq signal profiles of NPP-13 (red) or IMB-1 (green) knockdown embryos on top of wild-type profile (gray) at selected snoRNA genes. See Figure S1 for all snoRNA genes.
(D) Colorimetric representation of per-base RNA-seq read count at the 51 snoRNA genes exhibiting upstream RNA signals upon NPP-13 knockdown. RNA-seq read counts are normalized by genome-wide average of base coverage (also in G).
(E) Schematic of previously proposed Pol III-transcribed snoRNA processing (Li et al., 2008; Xiao et al., 2012).
(F) Northern blotting and RT-PCR detect uncleaved precursor snoRNAs in NPP-13 knockdown embryos. Densitometry analyses are shown under the images. Ethidium bromide staining of 5.8S rRNA (Pol I target) and 5S rRNA (TFIIIA-dependent Pol III target) shows the loading control.
(G) Average RNA-seq read count profiles at SL1 trans-splice sites and the 5′-end of exon 2 of protein-coding genes.
(H) DNA motifs found in the 51 snoRNA genes showing processing defect upon NPP-13 knockdown. −80 bp to +20 bp from annotated TSS (aTSS) were analyzed. E, Expected value.
(I) Pol III ChIP-seq read counts in 138 annotated snoRNA genes. The maximum read count in the 200 bp region centered on the aTSS were plotted. In order to plot all genes including those with 0 count in the logarithmic space, 1 count was added to all genes. See Supplemental Experimental Procedures for the criterion for dividing snoRNA genes into Pol III and Pol II-targets.
(J) Northern blotting detects precursor tRNA F56C3.t1 around 150 nt. The location of the probe is shown in K. The identity of the band at 125 nt is unknown.
(K) (Left) RNA-seq profiles (same as C) for tRNA genes, F56C3.t1 and K11E4.t5, which show downstream RNA signals, and R04E5.t3, which does not. The location of Pol III terminator poly(dT) tracts is indicated. (Right) RT-PCR detects precursor tRNAs with a long 3′-trailer. The primer locations are shown in the corresponding left panel.
(L) Schematic of tRNA 3′-end processing.
(M) RNA-seq DCPM scores for endonucleases that are predicted to cleave precursor Pol III-snoRNAs.

