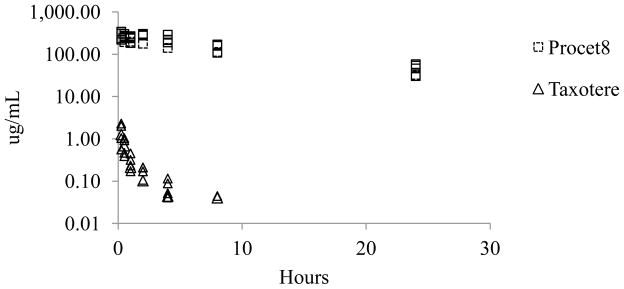
Figure 2. Procet 8 and DTX plasma profiles.

The pooled plasma concentration data are presented for the Procet 8 (squares) and Taxotere (triangles) treatment groups.

The pooled plasma concentration data are presented for the Procet 8 (squares) and Taxotere (triangles) treatment groups.