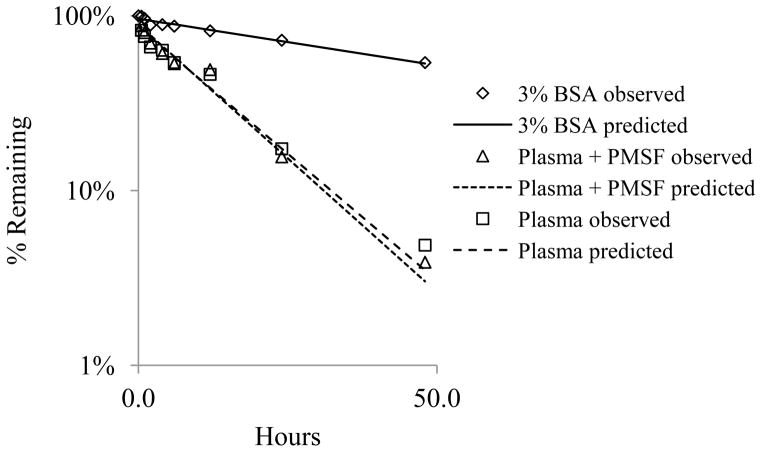
Figure 6. Hydrolysis of Procet 8 in rat plasma.
Procet 8 was incubated in rat plasma, with or without PMSF, or 3% BSA, as described in experimental methods. Displayed are % remaining of the initial Procet 8 concentration for the plasma (square), plasma + PMSF (triangle), and 3% BSA (diamond) at each incubation time point (Mean + SD). A first order rate, % Remaining = 100%*e (−K*Time), was fit to the Procet 8 hydrolysis data using uniform weighted regression analysis. The predicted lines from the model fit of each incubation condition, plasma (dashed line), plasma + PMSF (dotted line) and 3% BSA (solid line), are also displayed. Refer to text for half-life estimates.

