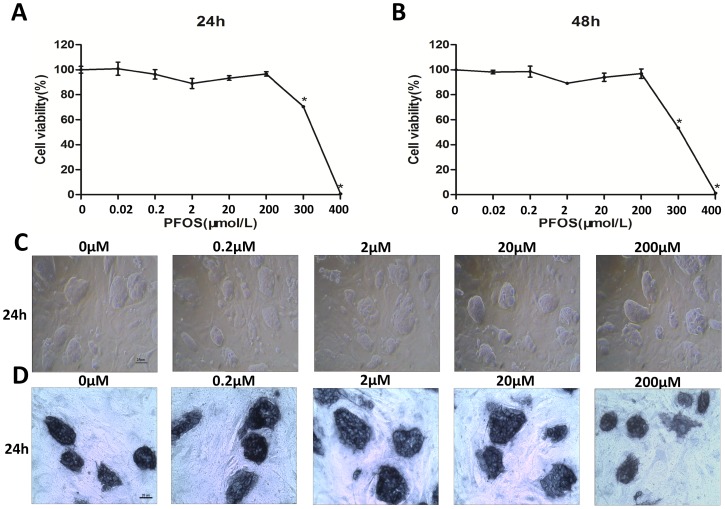
Figure 1. Effects of PFOS on cell viability and morphology in mESCs.
(A and B) Cell viability was determined by MTT assay after exposure to various concentrations of PFOS for 24 h and 48 h. (C) D3 mESCs was exposed to PFOS for 24 h, cell morphology was observed. Magnification, 100×. Cells were cultured with various concentrations of PFOS (0.2 µM, 2 µM, 20 µM, and 200 µM) or DMSO as control. (D) Effects of PFOS on alkaline phosphatase staining in mESCs. Cells were cultured with various concentrations of PFOS (0.2 µM, 2 µM, 20 µM, and 200 µM) or DMSO as control. Scale bar = 25 µm. Values of the experiment were represented as the percentages of cell viability compared with that of the control and expressed as means ± S.E. from five separate experiments in which treatments were performed in quadruplicate. *indicates significant difference when the values were compared to that of the control at p<0.05.

