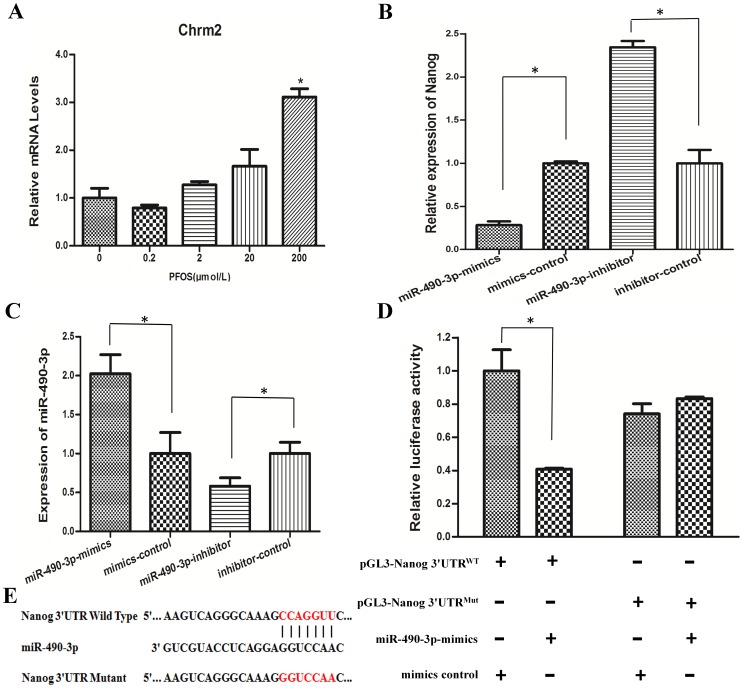
Figure 3. Over-expression of miR-490-3p reduced Nanog expression.
(A)The expression of its host gene Chrm2 mRNA levels was determined by quantitative real-time PCR using a housekeeping gene GAPDH as an internal control. Cells were cultured with various concentrations of PFOS (0.2 µM, 2 µM, 20 µM, and 200 µM) or DMSO as control for 24 h. (B) Cells were transfected with 50 nM miR-490 mimics or 100 nM miR-490 inhibitor for 24 h. qRT-PCR was performed to evaluate the mRNA level of Nanog. (C) The relative expression levels of miR-490-3p after transfection. (D) Cells were co-transfected with miR-490-3p mimics and negative control, renilla luciferase vector pRL-SV40 and Nanog 3′UTR luciferase reporters for 24 h. Both firefly and Renilla luciferase activities are measured in the same sample. Firefly luciferase signals were normalized with Renilla luciferase signals. (E) Sequence alignment of miR-490-3p with 3′ UTR of Nanog. Bottom: mutations in the 3′UTR of Nanog in order to create the mutant luciferase reporter constructs. *indicates significant difference compared with that of control cells (P<0.05). All tests were performed in triplicate and presented as means±SE. Reporter activity was significantly decreased after miR-490-3p overexpression compared to control (P<0.05).

