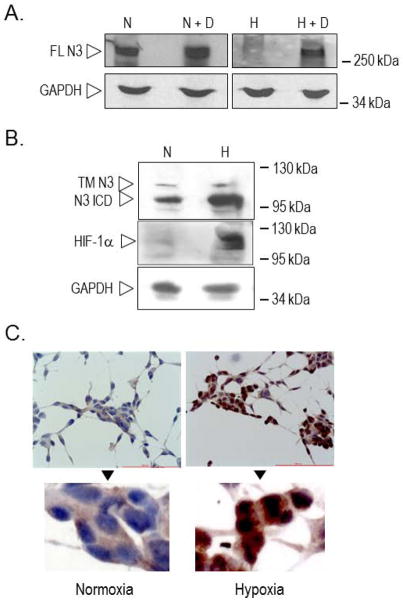
Figure 1. Expression of Notch3 in PC cells exposed to normoxia and hypoxia.
A. Total cell lysates from cells exposed to normoxia (N), normoxia + 20 μM DAPT (N+D), hypoxia (H) or hypoxia + 20 μM DAPT (H+D) for 7 days, were analyzed by Western blotting using anti-Notch3 specific antibody. FL N3: full length Notch3; GAPDH indicates normalization of protein loading. B. Total cell lysates from cells exposed to normoxia (N) or hypoxia (H) for 7 days, were analyzed by Western blotting using anti-Notch3 and anti-HIF1α specific antibodies. TM N3: transmembrane Notch3; N3 ICD: Notch3 intracellular domain. GAPDH indicates normalization of protein loading. C. Notch3 immunostaining of PC cells exposed to normoxia or hypoxia for 7 days.

