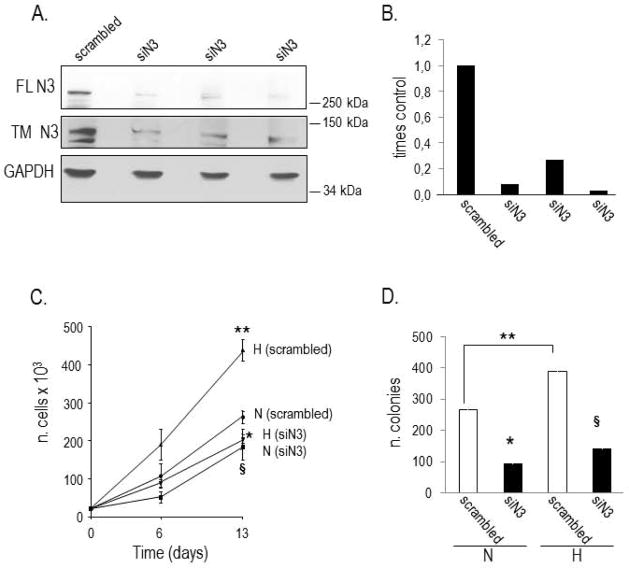
Figure 2. Analysis of anchorage-dependent and independent growth of Notch3 silenced (siN3) PC cells exposed to normoxia and hypoxia.
A. Expression of full length (FL) and cleaved (transmembrane, TM) Notch3 in cells transduced with scrambled siRNA and Notch3 siRNA (siN3). GAPDH indicates normalization of protein loading. B. Densitometric analysis of FL Notch3 immunoreactive bands detected in three different N3 siRNA clones (siN3) and scrambled siRNA cells, normalized to GAPDH. The amount of Notch3 protein in control cells is equal 1. C. Growth curve of scrambled siRNA and siN3 cells exposed to normoxia (N) and hypoxia (H). Hypoxia significantly increases, while silencing of Notch3 decreases, the proliferation rate of PC cells. Statistical analysis: **p<0.05 H vs. N in scrambled siRNA cells; *p<0.0001 siN3 vs. scrambled siRNA cells, under H; § p<0.01 siN3 vs. scrambled siRNA cells, under N. D. Colony formation in soft agar of scrambled siRNA (white columns) and siN3 (black columns) cells exposed to normoxia (N) and hypoxia (H) for three weeks. Hypoxia significantly increases, while silencing of Notch3 decreases, the ability of PC cells to form colonies. Statistical analysis: **p<0.03, H vs. N in scrambled siRNA cells; *p<0.004, siN3 vs. scrambled siRNA cells, under N; §p<0.01, siN3 vs. scrambled siRNA cells, under H.

