
Figure 3. Analysis of cholesterol level and lipid raft composition of PC cells exposed to normoxia and hypoxia.
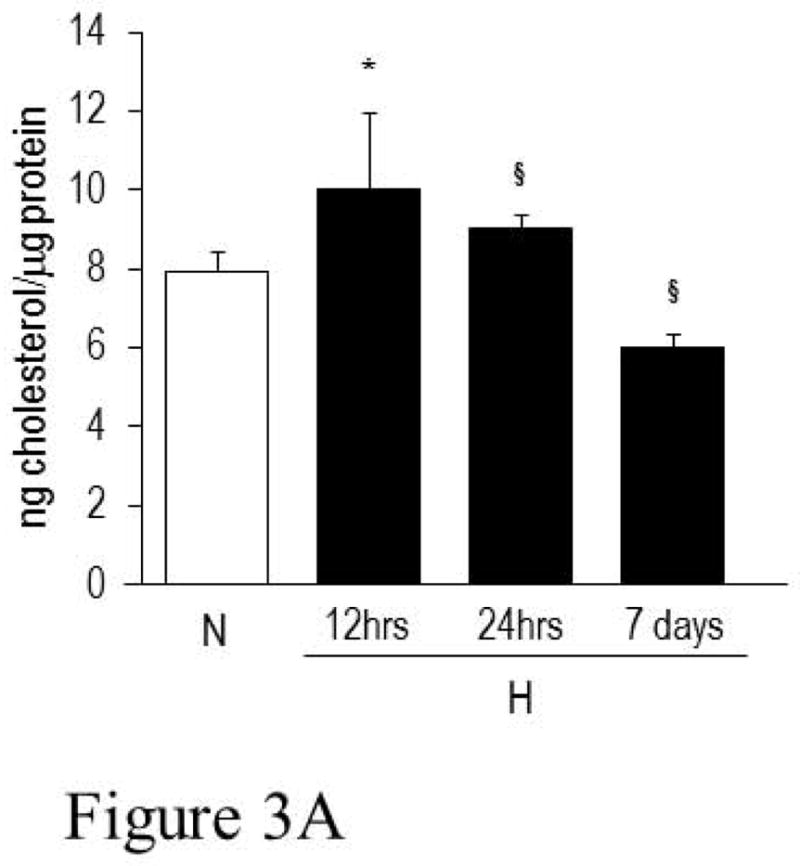

A. Amount of total cell cholesterol detected in cells maintained under normoxia (N) or exposed to hypoxia (H) for 12 hrs, 24 hrs and 7 days. Statistical analysis: *p<0.003, H 12 hrs vs. N; §p<0.001, H 24 hrs and 7 days vs. N. B. Fluorescence analysis for the assessment the number/size of raft clusters. Data are based on the analysis of rearrangement of membrane rafts and are obtained by pooling data from each single cell. Control data are presented as raw data obtained by ImageJ analysis of a wide pool of control cells. Other data are presented as percentage changes compared with control. The second column reports the percentage change in the area of labeled contiguous structures that is taken as a measure of raft clusterization. Rafts for each cell were obtained by isolating high fluorescent spots, restricting the fluorescent spot by size, and processing data with the “Analyze Particle” command contained in ImageJ 1.44 software.