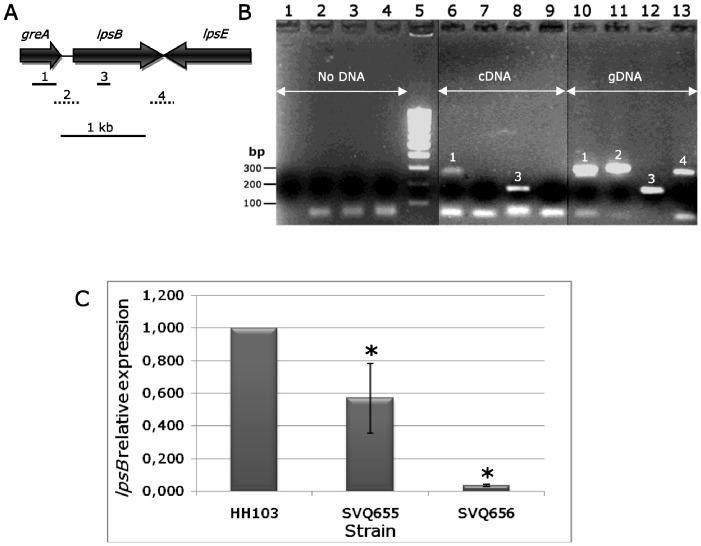
Figure 4. The Sinorhizobium fredii greA and lpsB genes are not cotranscribed but greA affects lpsB expression.
A, genetic organization of the greA-lpsB-lpsE region. Solid lines show the position of the greA (1, 284-bp) and lpsB (3, 156-bp) internal fragments that were successfully amplified (positive controls) using cDNA or gDNA as template. Dotted lines show the positions of the PCR fragments covering the intergenic greA-lpsB (2, 156-bp) and lpsB-lpsE (4, 282-bp) regions that were amplified from gDNA but not from cDNA. B, agarose gel electrophoresis of samples resulting from PCR and RT-PCR experiments. lanes 1–4, controls without DNA; lane 5, 100bp-ladder DNA marker; lanes 6–9, HH103 cDNA; lanes 10–13, HH103 gDNA. Primers used: greAintF and greAintR (lanes 1, 6, and 10), greAlpsB-F and greAlpsB-R (lanes 2, 7, and 11), rtlpsB-F and rtlpsB-R (lanes 3, 8, and 12), lpsBE-F and lpsBE-R (lanes 4, 9, and 13). DNA marker 100, 200, and 300-bp bands are indicated on the left of the figure. C, relative lpsB expression of S. fredii HH103 strains SVQ655 (greA::lacZΔp-GmR, →→) and SVQ656 (greA::lacZΔp-GmR, →←) in comparison to that of wild type HH103 RifR. RNA was extracted from early exponential phase cultures grown in YMB. Each strain was pairwise compared with HH103 RifR by using the Mann-Whitney non-parametrical test. In both cases, the relative expression of lpsB was significantly different from that of HH103 RifR at the levels α = 5% (indicated with a black asterisk),

