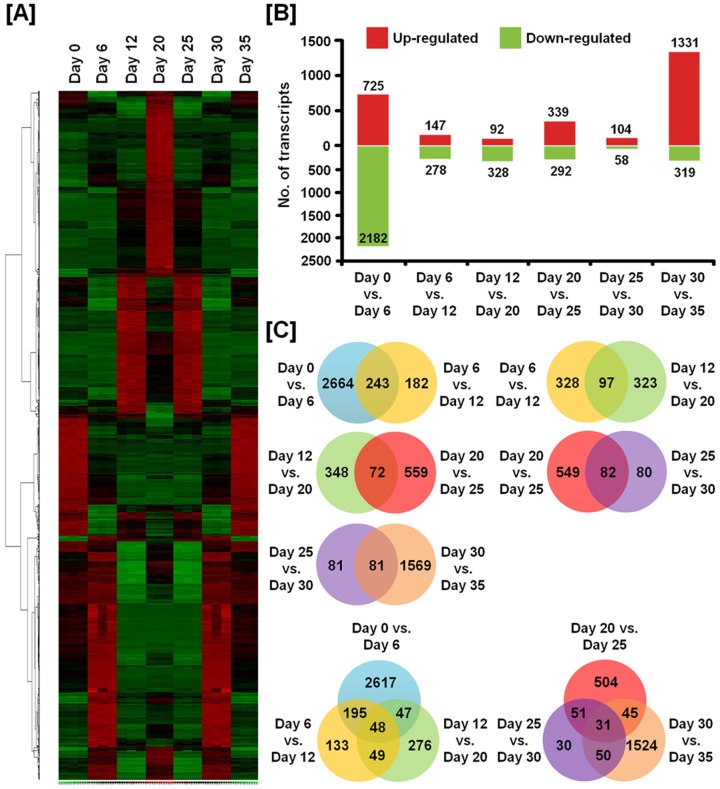
Figure 5. Identification of significant up- or down-regulated genes on each day during regression and regeneration of the oviduct.
(A) Heat map of hierarchically clustered genes detected alterations in their expression across the time course of this study. (B) The number of transcripts for which expression increased or decreased significantly in the magnum on different days. Differentially expressed genes were selected using two-sample comparison according to the following criteria: lower bound of 90% confidence interval of fold-change greater than 2.0 and an absolute value of difference between groups means greater than 100. (C) The numbers displayed within the intersections of the circles indicate the number of common genes in the two or three comparisons.

