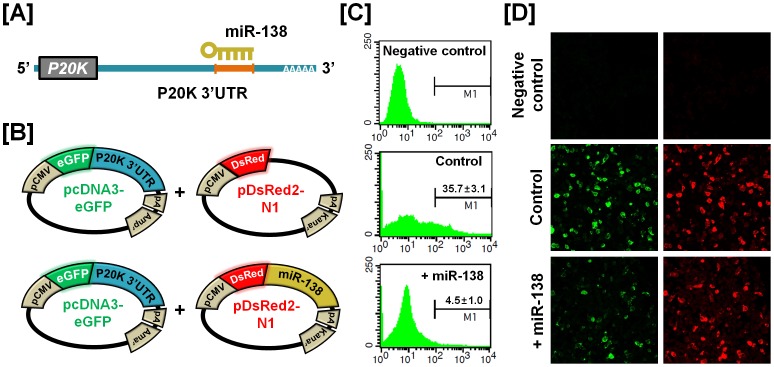
Figure 12. In vitro target assay for expression of the chicken miR-138 on expression of the p20K transcript.
(A) Diagram of miRNA binding site in the 3′-UTR region of the p20K transcript. (B) The maps of eGFP-p20K 3′-UTR expressing and DsRed-miR-138 expressing vector. The p20K 3′-UTR sequence was subcloned between the eGFP gene and the polyA tail, generating the fusion construct of the GFP transcript following the p20K 3′-UTR (left panel). A miRNA expressing vector was designed to generate DsRed and miR-138 fused transcript or only DsRed transcript for the experimental control (right panel). (C and D) After co-transfection of pcDNA-eGFP-p20K 3′-UTR and pcDNA-DsRed-miR-138 into 293FT cells, the fluorescence signals of GFP and DsRed were detected using FACS (C) and fluorescent microscopy (D). In panel C, a gated event value from histogram statistics was used to find statistical percentages of the positive events (GFP-expressing cells) and the numbers indicate mean±SEM of three independent experiments.

