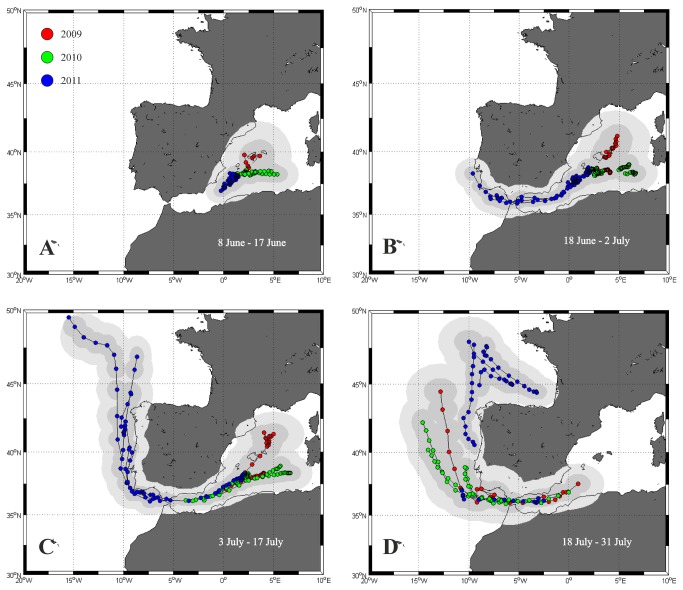
Figure 2. Tracks (with 50% and 95% confidence intervals) from PSAT tags deployed in 2009 (red circles), 2010 (green circles) and 2011 (blue circles).
Paths are presented in four consecutive sequences covering the months of June and July. (A) Period between the tagging date (8, 9 or 14 June) and 17 June; this panel includes tracks from 11 tags (2 of 2009, 4 of 2010 and 5 of 2011). (B) 18 June-2 July; 11 tags (2 of 2009, 4 of 2010 and 5 of 2011). (C) 3-17 July; 11 tags (2 of 2009, 4 of 2010 and 5 of 2011). (D) 18-31 July; 10 tags (2 of 2009, 4 of 2010 and 4 of 2011).

