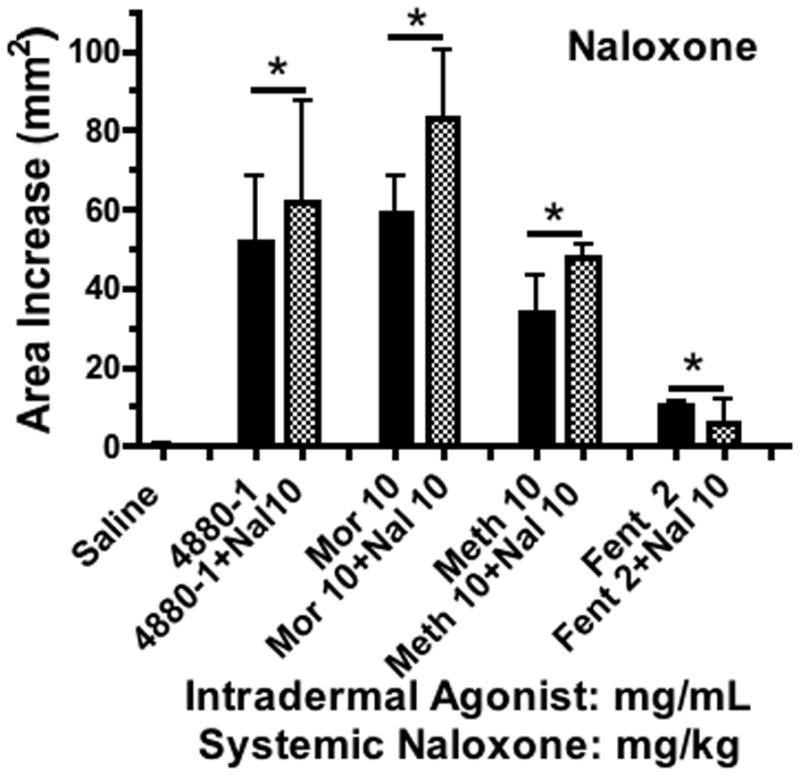
Figure 8.

Histograms showing the cutaneous flare area at approximately 30 min after subcutaneous injection of different concentrations of 48–80, morphine, methadone or fentanyl (mg/mL) in animals pretreated with naloxone (10mg/kg). Each histogram presents the mean ± SEM of 3–5 subcutaneous injections. 1-Way ANOVA analysis across treatments showed a significant main effect (p<0.0001). *Post hoc using Dunnett’s multiple comparison: * p<0.05 vs. saline. Post hoc t-test with Bonferroni correction: drug alone vs. drug + naloxone were not different (p >0.05).
