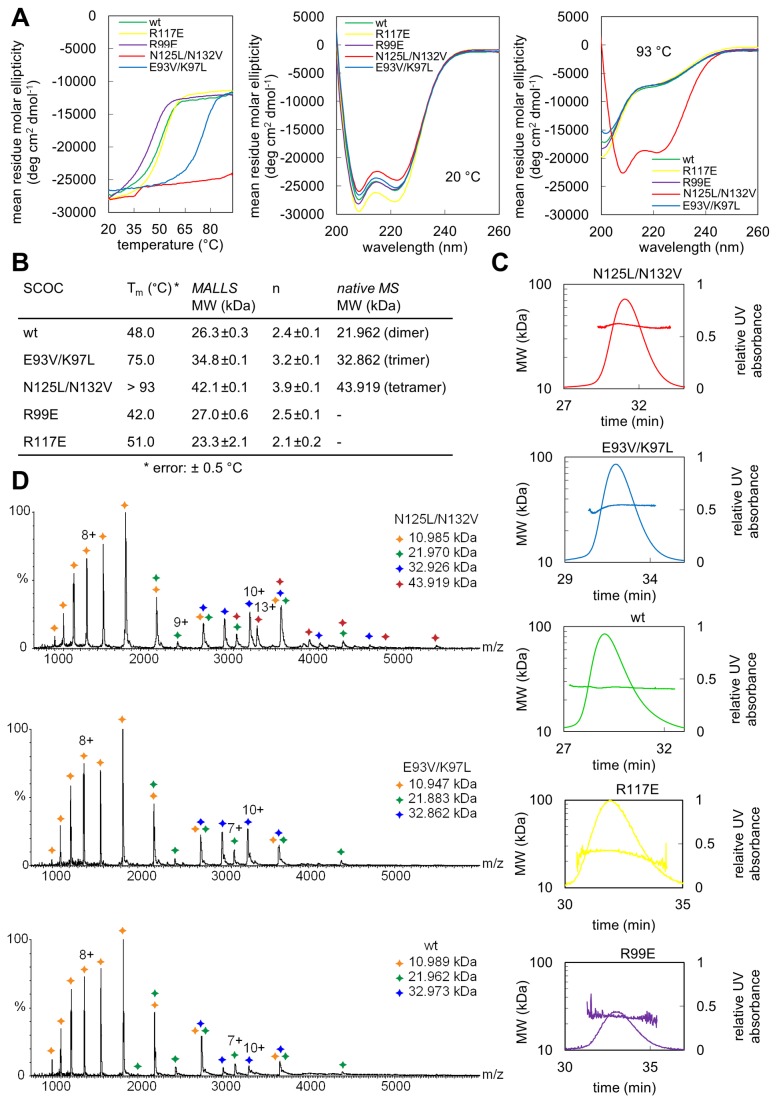
Figure 2. Biophysical characterization of SCOC mutants.
(A) Analysis of SCOC mutants by CD spectroscopy. Thermal unfolding curves were recorded from 20 to 93 °C at a wavelength of 208 nm, which is the global minimum in the SCOC CD spectrum (left panel). The protein concentration was approx. 15 µM. Middle and right panels show CD spectra of SCOC mutants measured from 200 to 260 nm at 20 °C and 93 °C, respectively. (B) Summary of the melting temperatures (Tm) and molecular weights (MW) measured for all SCOC constructs. Molecular weights were determined from three SEC-MALLS measurements for each mutant. The stoichiometry (n) is the ratio of the measured molecular weight by MALLS and the MW of a single Strep-tagged SCOC molecule (11206 Da). Molecular weights for the wild-type and double core mutants were also determined by native mass spectrometry. (C) Elution profiles and corresponding molecular weights determined by SEC-MALLS are shown for wild-type SCOC and mutants. (D) Mass spectra of native wild-type SCOC and the E93V/K97L and N125L/N132V mutants are shown.

