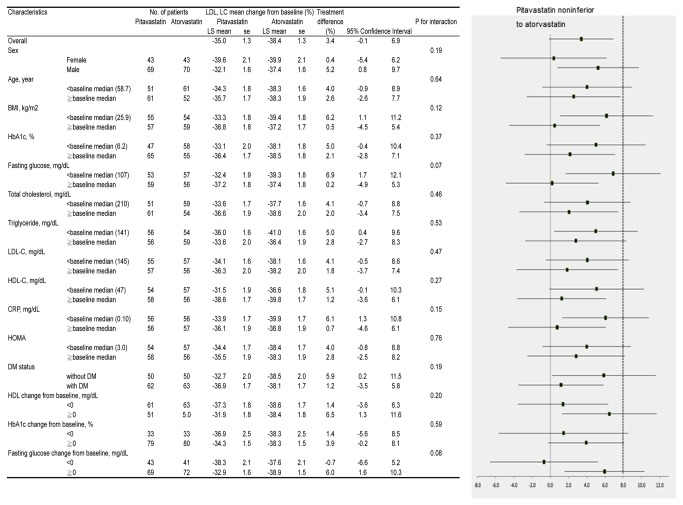
Figure 3. Subgroup analysis comparing the percentage of participants with final LDL-C level < 100 mg/dL after 12 weeks of either pitavastatin (2 mg) or atorvastatin (10 mg) treatment.
Continuous variables are means ± SD. ADMA = asymmetric dimethylarginine; ALT = alanine aminotransferase; Apo A1 = apolipoprotein A1; Apo B = apolipoprotein B; AST = aspartate transaminase; BMI = body mass index; BUN = blood urea nitrogen; CPK = creatine phosphokinase; CRP = C-reactive protein; DM = Diabetes mellitus; Gamma GT = gamma-glutamyl transpeptidase; HDL-C = high-density lipoprotein cholesterol; HOMA-IR = homeostatic model assessment-insulin resistance; LDH = lactate dehydrogenase; LDL-C = low-density lipoprotein cholesterol; TG = triglyceride.

