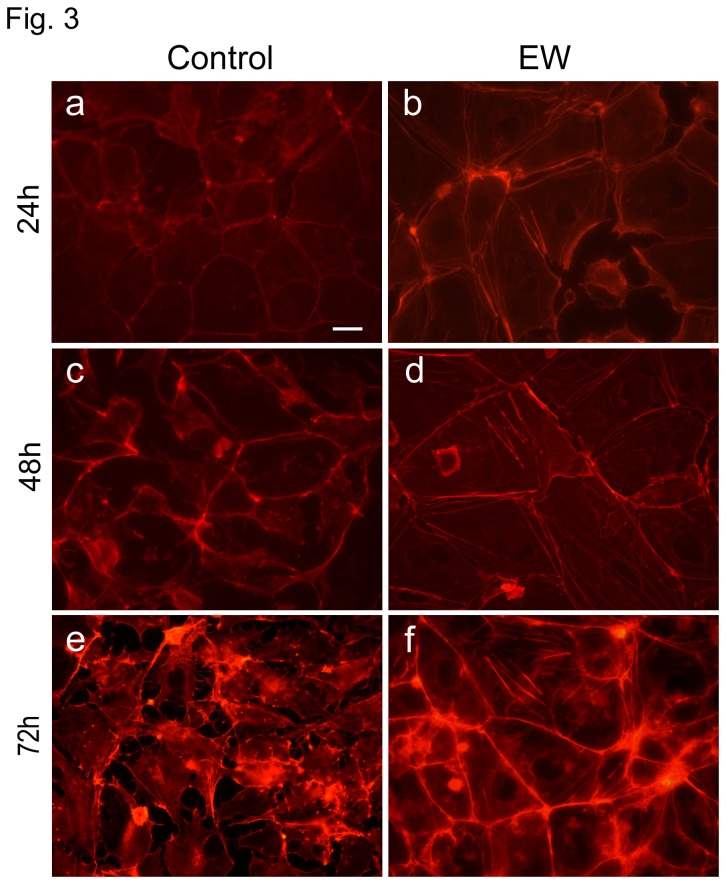
Figure 3. EW changes F-actin distribution pattern.
Rhodamine-phalloidin staining of TCam-2 showing F-actin distribution pattern after 24, 48, and 72 hours of culture in the presence or absence of 10% EW. In a, c, and e control cells are shown whereas in b, d, and f EW cultured cells are shown. Bar, 20 µm.

