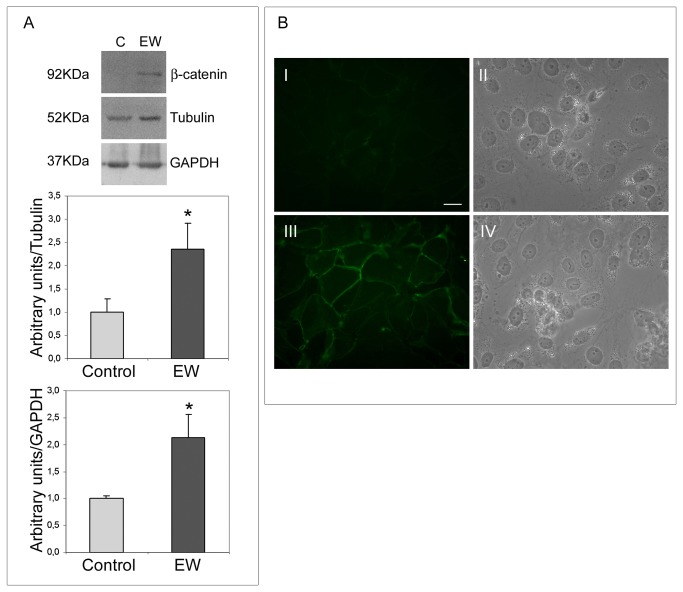
Figure 6. EW up-regulates β-catenin expression in TCam-2 cells.
A) Western blot analysis of β-catenin in TCam-2 cells cultured with or without 10% EW for 72 hours. A 92 kDa band corresponding to the predicted β-catenin molecular weight was detected by immunoblot analysis. The densitometric analyses of the bands, normalized versus tubulin and versus GAPDH, observed in three different experiments, are reported. Statistical significance was evaluated by Student’s T test. * vs. control, P< 0.05. B) Immunodetection of β-catenin in TCam-2 cells cultured in absence (I) or in the presence of 10% EW (III) for 72 hours. In II and IV the respective bright fields are reported. Bar, 20 µm.

