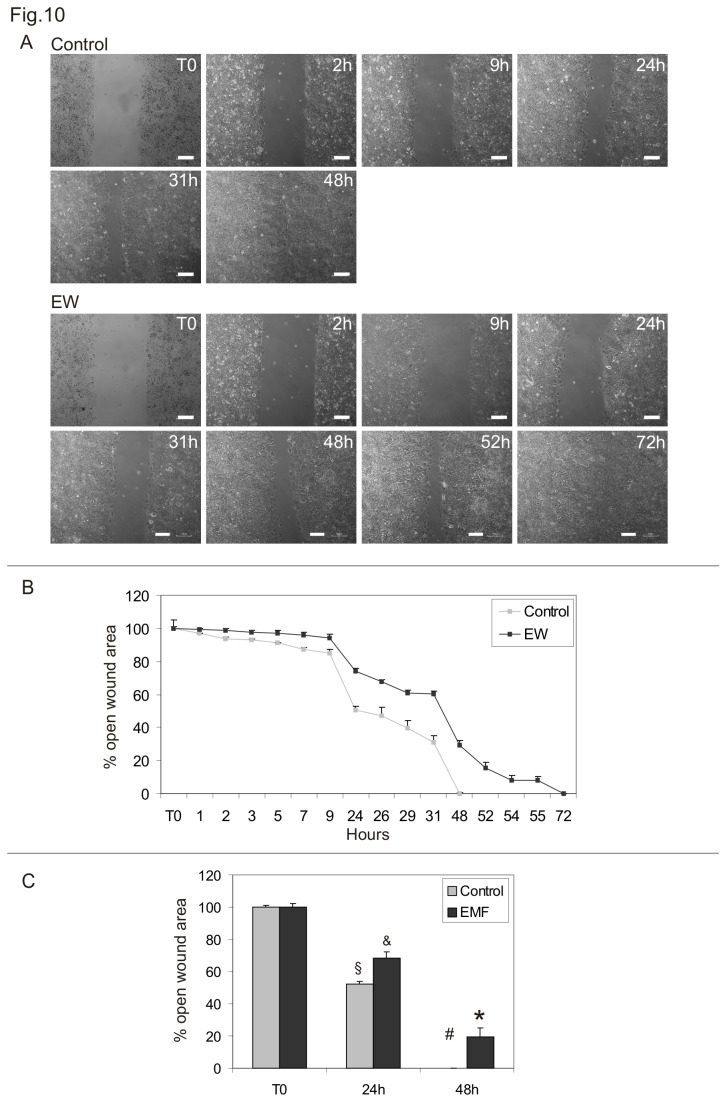
Figure 10. EW modifies TCam-2 cells collective migration.
Cell wound healing assay. A) Representative phase-contrast microscopy of TCam-2 control cells and EW treated cells of one representative experiment at different time points after the beginning of wound healing assay. Bars, 100 µm. B) Graphical representation of the percentage of open wound area in control and EW treated cells from time 0 to 72 hours of culture. The values were normalized against the wound’s width at time 0. Values relative to one representative experiment performed in duplicate are shown. C) Graphical representation of the percentage of open wound area in control and EW treated cells at time 0, 24 and 48 hours of culture. The values were normalized against the wound’s width at time 0. The mean values of three independent experiments are shown. Statistical significance was evaluated by ANOVA test. Same symbols (n.s.). Different symbols (P<0.05).

