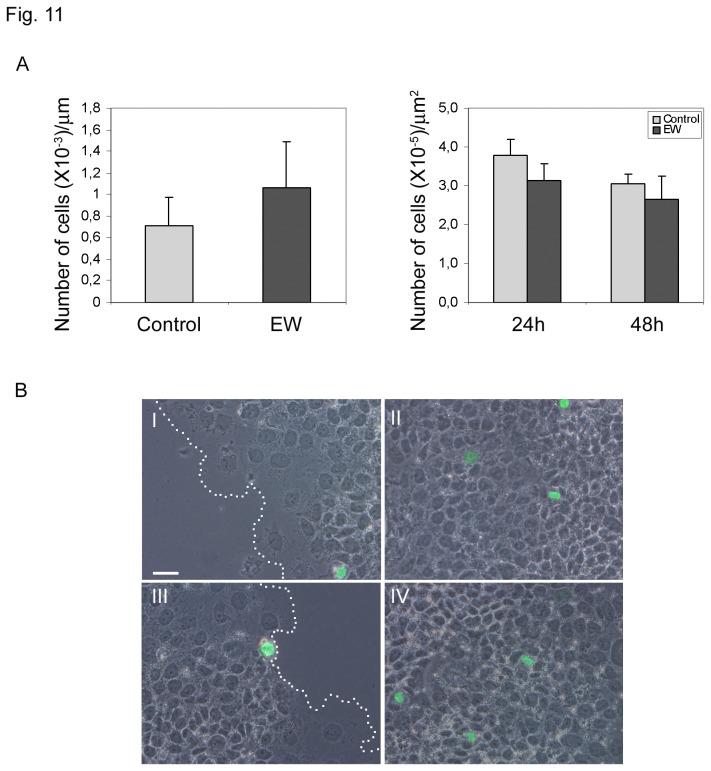
Figure 11. EW does not modify the number of pHistone H3 positive cells in the wound healing assays.
A) Graphs indicating the number of pHistone H3 positive cells/µm at the wound’s edge (24 hours of culture; left graph) and the number of pHistone H3 positive cells/µm2 on area where cells are confluent (24 and 48 hours of culture; right graph). The number of pHistone H3 positive cells at 48 hours of culture at the wound’s edge were not reported since at this culture time control samples completely close the wound. Statistical analysis, evaluated by Student’s T test, was not significant.
B) Images obtained merging phase contrast microscopy with pHistone H3 FITC immuno-detection. I and II represents images of control samples photographed at wound’s edge (I) and on area where cells are confluent (II). Dashed lines in I and II represent wound’s border. III and IV represents images of EW treated cells photographed at wound’s edge (III) and on area where cells are confluent (IV). Bar 50 µm.

