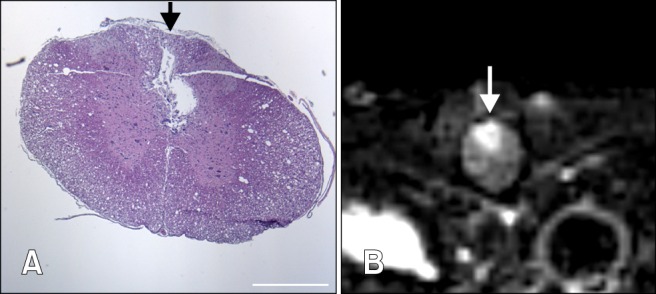
Fig. 4.

Observations from the 50 µL group of rats. (A) Transversal section of the margin of the lesion of the 50 µL group stained with H&E revealing cavitation and glial scar formation of the dorsal funiculus. Scale bar = 500 µm. (B) Transverse T2-weighted images of the margin of the lesion of the 50 µL group showing a wedge-shaped hyperintensity signal in the dorsal part.
