Figure 2.

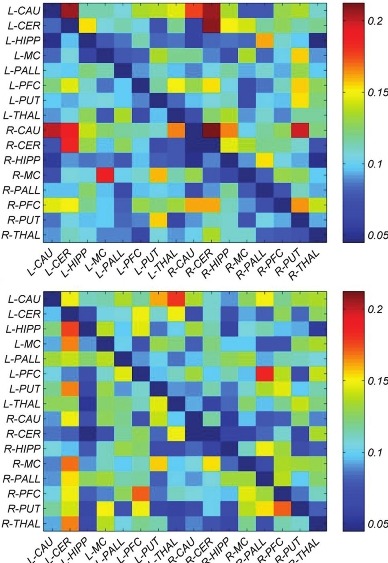
The group direct influence of each pair of ROIs was calculated by the Granger influence matrices across all the subjects in healthy group (top) and in Parkinson patients (below). Abberivations as in Table 1

The group direct influence of each pair of ROIs was calculated by the Granger influence matrices across all the subjects in healthy group (top) and in Parkinson patients (below). Abberivations as in Table 1