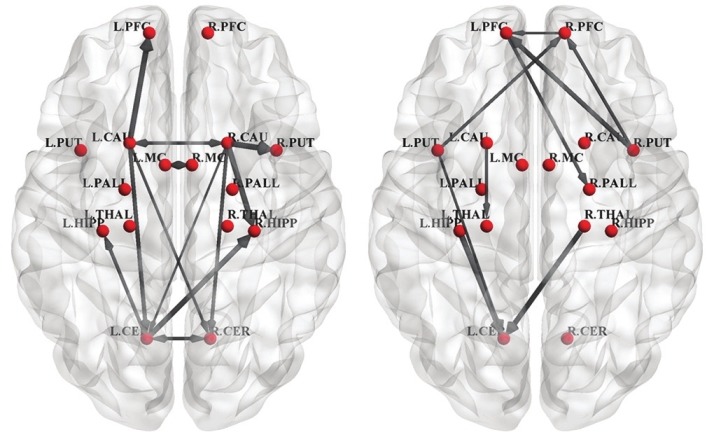
Figure 4.

Variations of GC coefficients corresponding to significant connections of normal control (left) and Parkinson's disease (right). Only significant connections are shown. The width of connection arrow represents standard deviation value of coefficients
