Figure 6.

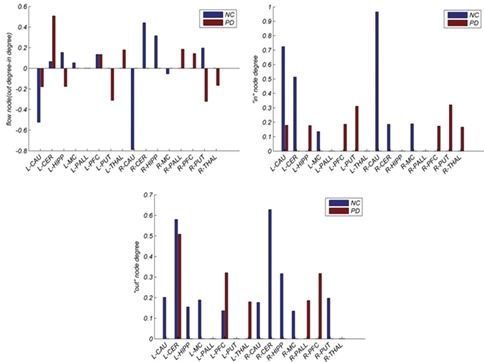
Total degree, in-degree, and out-degree of significant connections of the directed influence brain network are displayed from top to bottom row, respectively. The first blue column is related to the healthy and second to PD

Total degree, in-degree, and out-degree of significant connections of the directed influence brain network are displayed from top to bottom row, respectively. The first blue column is related to the healthy and second to PD