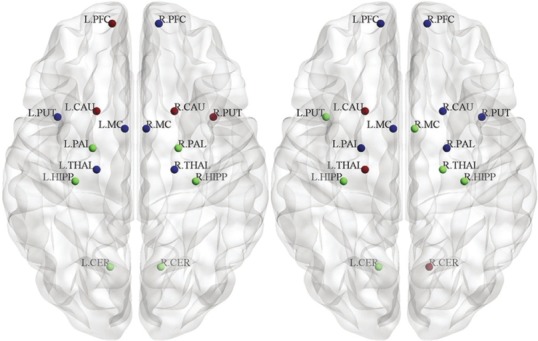
Figure 8.

Modularity of the directed influence brain network. Three module in normal control (left) and Parkinson's disease (right). Regions that are placed at their respective centroids are marked by using different colored spheres at the axial view
