Figure 2.

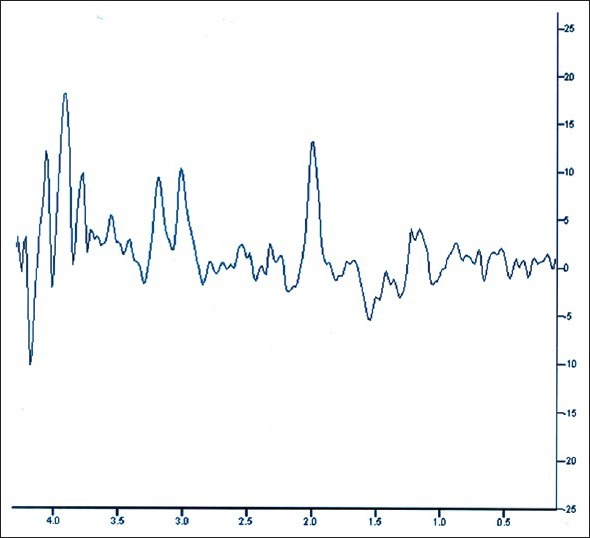
MR spectroscopy of the brain showing lactate peak at 1.3 micrometer during symptomatic stage of the disease with probe placed at right occipital region

MR spectroscopy of the brain showing lactate peak at 1.3 micrometer during symptomatic stage of the disease with probe placed at right occipital region