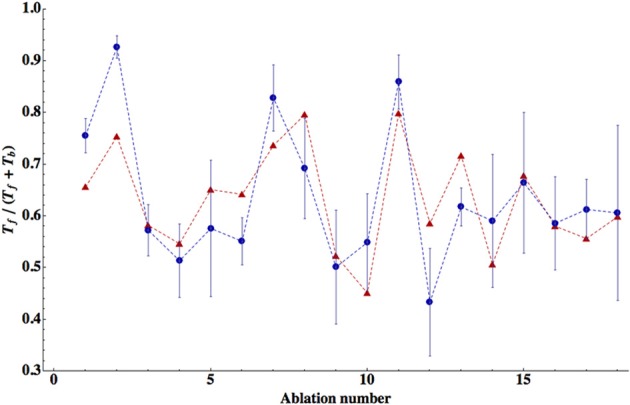
Figure 2.

Comparison of the theory with the data for relative times spent in forward locomotion across different ablations. The theoretical values are for the winning polarity combination # 1, corresponding to all inhibitory neurons. Correlation between theoretical points (red triangles) and experimental (blue circles) is relatively high (R = 0.743) and statistically significant (p = 0.0004). The error bars for the experimental points were computed from SEM values of Tf and Tb given in Table 2. The optimal values of the free parameters are given in Table 3.
