
Figure 6.
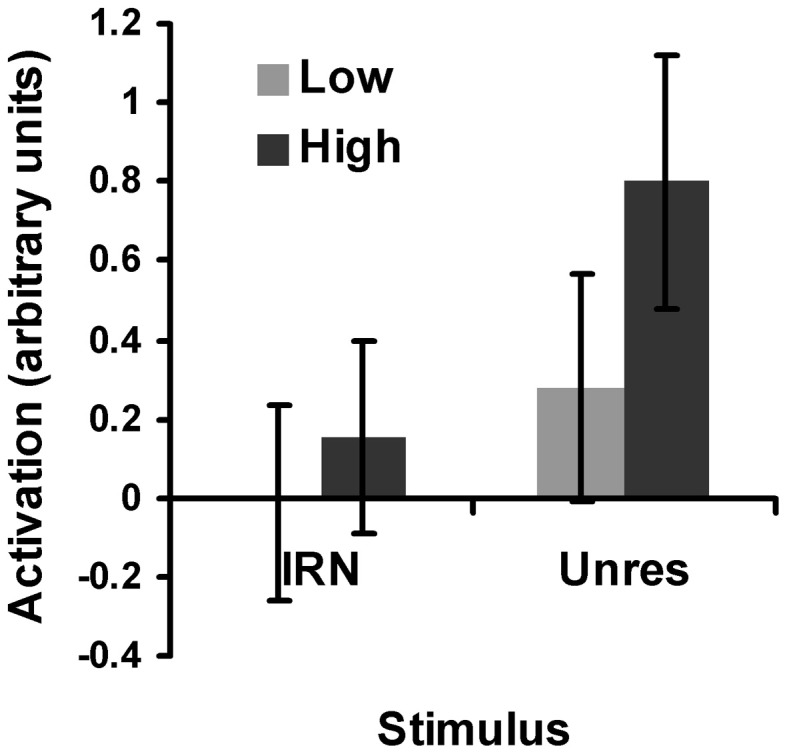
Plot of the salience analysis results for IRN and for unres within the spherical pitch ROI. “Activation” refers to the average beta weights: a numerical measure of the effect size. The low salience conditions are represented by the light gray bars and the high salience conditions are represented by the dark gray bars. For the low-salience IRN condition, IRNo4 has been subtracted from IRN4 and for the high-salience condition, IRNo64 has been subtracted from IRN64 to remove the effects of slow modulation. Error bars represent 95% confidence intervals.