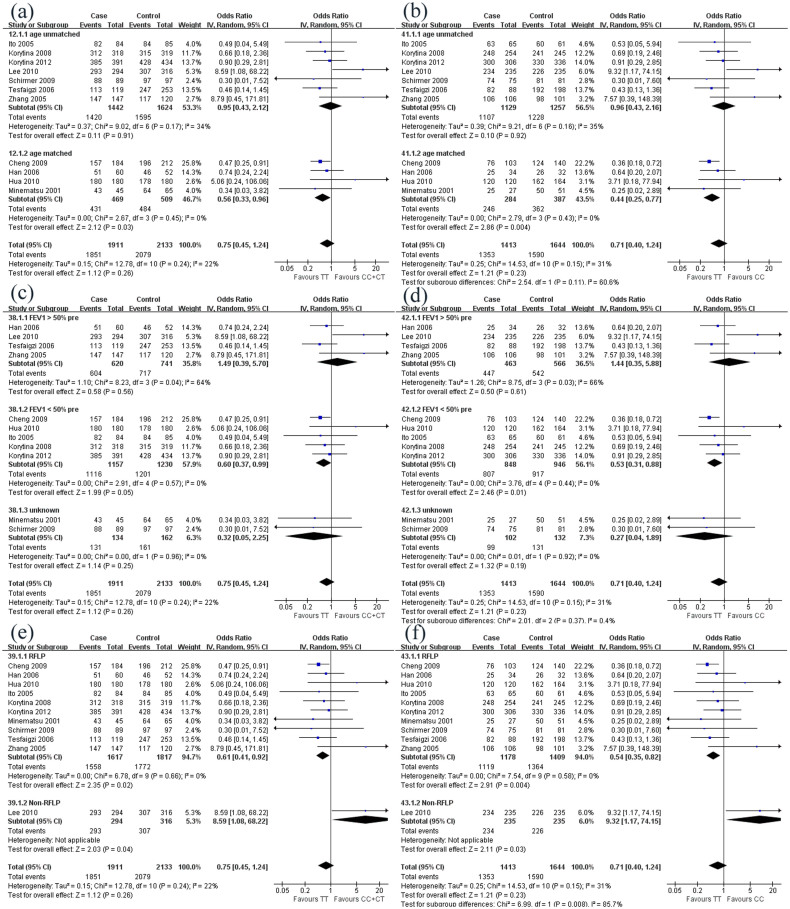
Figure 2. Subgroup analysis of correlation between MMP9 polymorphism and COPD risk under two pairs of comparisons (CC + CT vs. TT; CC vs. TT).
(a–b) The studies were divided into two groups according to age (unmatched or matched) under the comparison of CC + CT vs. TT (a) and CC vs. TT (b); (c–d) The studies were divided into three groups according to lung function (FEV1 > 50% prediction, FEV1 < 50% prediction or unknown) under the comparison of CC + CT vs. TT (c) and CC vs. TT (d); (e–f) The studies were divided into two groups according to genotype identification method (RFLP or Non-RFLP) under the comparison of CC + CT vs. TT (e) and CC vs. TT (f).

