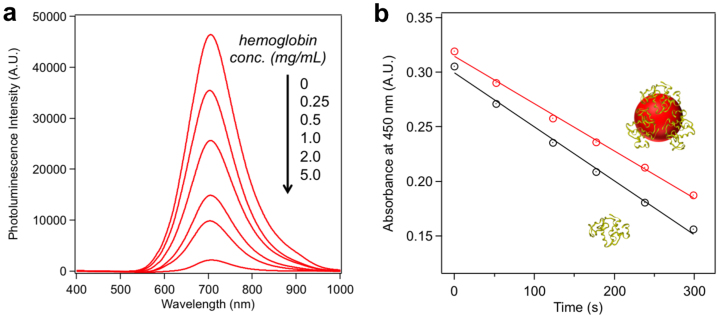
Figure 4. Characterization of hemoglobin-QDs and lysozyme-QDs.
(a) Photoluminescence quenching of ZnxHg1-xSe QDs synthesized at different hemoglobin concentrations. (b) Determination of lysozyme activities in native form (black line) and QD-associated form (red line). Linear fit for native lysozyme: y = −0.000495x + 0.299; linear fit for QD-associated lysozyme: y = −0.000434x + 0.315. The slope is used to determine the lysis rate.

