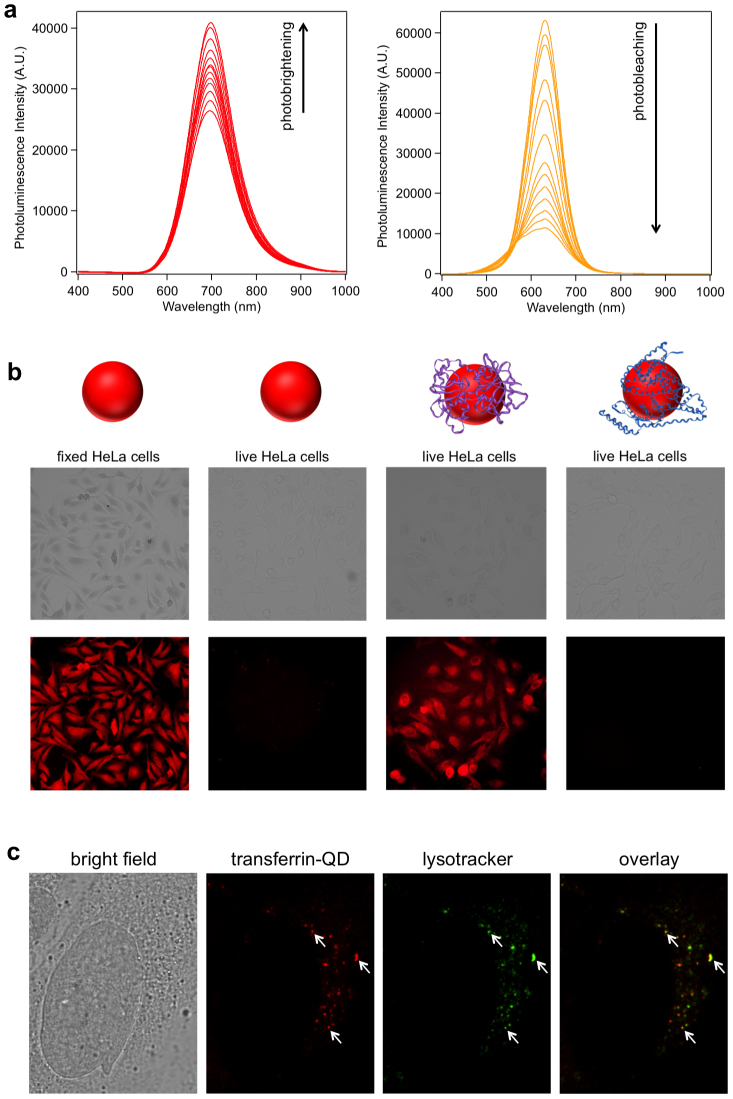
Figure 5. ZnxHg1-xSe QDs for cell imaging.
(a) Photostability measurements of unfunctionalized ZnxHg1-xSe QDs and CdTe QDs. Both QDs were continuously excited with a 405 nm laser (110 mW) and the photoluminescence spectra were recorded at different time points (0, 0.5, 1, 3, 5, 8, 12, 15, 20, 30, 40, 50, 60 min) (b) Bright field and fluorescence images of cells incubated with ZnxHg1-xSe QDs. From left to right: fixed HeLa cells with MPA-QDs; live HeLa cells with MPA-QDs; live HeLa cells with transferrin-QDs; live HeLa cells with BSA-QDs. The images were acquired with a 10× objective. See Supplementary Information (section 4.5) for the fluorescence image acquired with a 40× objective which shows punctate patterns of cell staining. (c) Bright field and confocal fluorescence microscopy image of a singe HeLa cell incubated with transferrin-QDs (red) and Lysotracker Green DND-26. The overlay image shows a high co-localization between the QDs and lysotracker. (Representative regions of overlap are indicated by arrows.)

