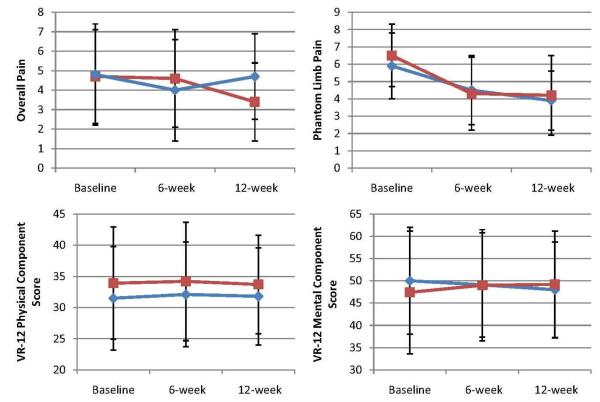
Fig 2.
Mean changes in 4 outcomes at 6 and 12 weeks, according to treatment groups. Outcome scores are shown for the true Farabloc group (blue diamonds) and sham Farabloc group (red squares). The values shown are unadjusted means; I bars indicate 95% CIs. Measurements were obtained at baseline, 6 weeks, and 12 weeks. Overall pain and PLP assessments were made on a visual analog scale from 0 (no pain) to 10 (excruciating pain). Summary scores on the physical and mental components of the VR-12 are scored on a T-score metric (mean ± SD: 50± 10), with higher scores indicating better health status.

