Figure 3.
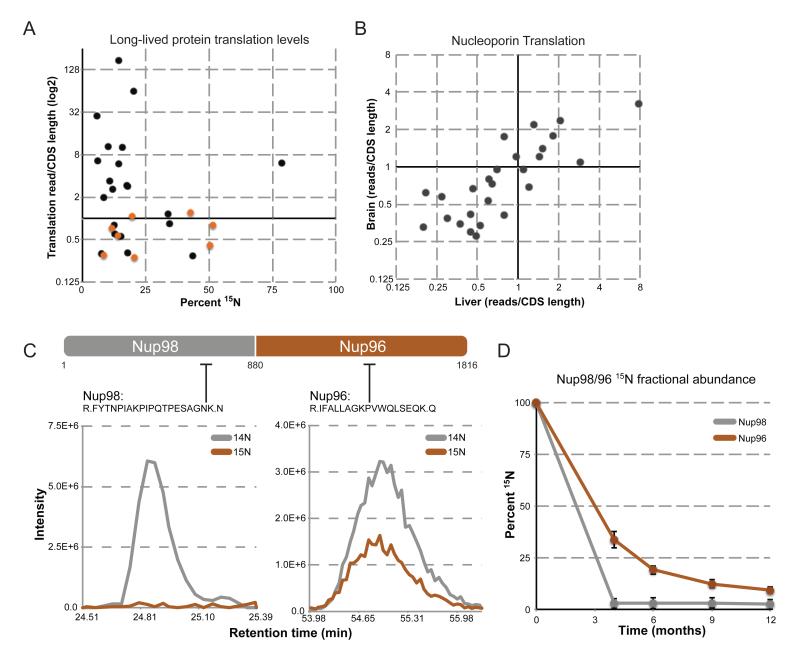
Protein translation does not correlate with protein lifespan. (A) Protein translation levels of long-lived proteins. Translation levels (reads/CDS length) of long-lived proteins are plotted (log2) against their corresponding 15N fractional abundance at 6 months post-chase. Translation levels of long-lived nucleoporins are plotted in orange. (B) Translation levels of NPC proteins in liver and brain tissue. Translation levels of all NPC proteins were determined in liver (horizontal axis) and brain (vertical axis) tissue, and plotted against each other (log2). (C) Translation and stability of Nup98/96. Top: Schematic of the Nup98/96 translated peptide, as well as the cleavage site (a.a. 880) that produces the separate Nup98 and Nup96 proteins. Lower: Elution profile MS1 traces of the indicated peptides from the Nup98 and Nup96 region, plotted as describe for Figure 1 D-G. (D) Stability of Nup98/96 over 12 months. Average 15N fractional abundance for Nup98 (grey) and Nup96 (orange) was determined from multiple peptides for each indicated time point and plotted over time.

