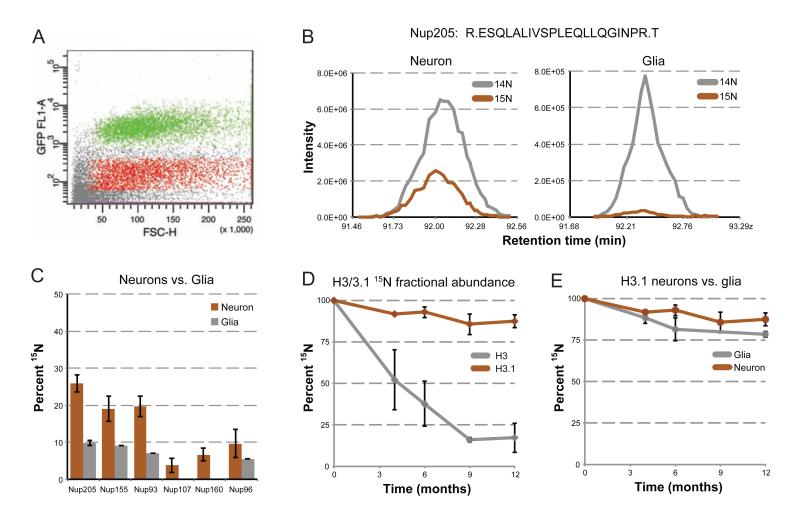
Figure 4.
15N fractional abundance decay rates in neuronal versus glial nuclei. (A) FACS sorting of brain nuclei. Brain nuclei were purified and labeled with a fluorescent marker for neuronal nuclei (NeuN), and sorted for NeuN positive and negative populations. Plotted is a scatter plot of representative sorted events, with positive (green) and negative (red) sorted populations highlighted. (B) 15N fractional abundance decay of Nup205 in neurons versus glia. Elution profile MS1 traces, as described earlier, are plotted for the same peptide from Nup205, originating from neuron-enriched (left) and glial-enriched (right) sorted nuclei from a 1-year post-chase rat. (C) 15N fractional abundance decay of Nups in neurons versus glia. Average 15N fractional abundance for each indicated Nup was determined from multiple peptides from the same neuron-enriched (orange) and glial-enriched (grey) nuclei described in B. (D) Histone H3.1 stability. 15N fractional abundance was determined for the single unique H3.1 peptide at 0, 4, 6, 9, and 12 months post-chase from multiple animals (orange), and plotted against peptides from the same time points which were common to all histone H3 variants (grey). (E) Histone H3.1 in neurons versus glia. 15N fractional abundance was determined for the single unique H3.1 peptide at 0, 4, 6, 9, and 12 months post-chase from neuron-enriched (orange) and glial-enriched (grey) sorted nuclei, and plotted over time. Note: we did not observe any peptides for glia 9-months post-chase. All error bars are plotted as a standard deviation. See also Figure S4.

