Figure 6.
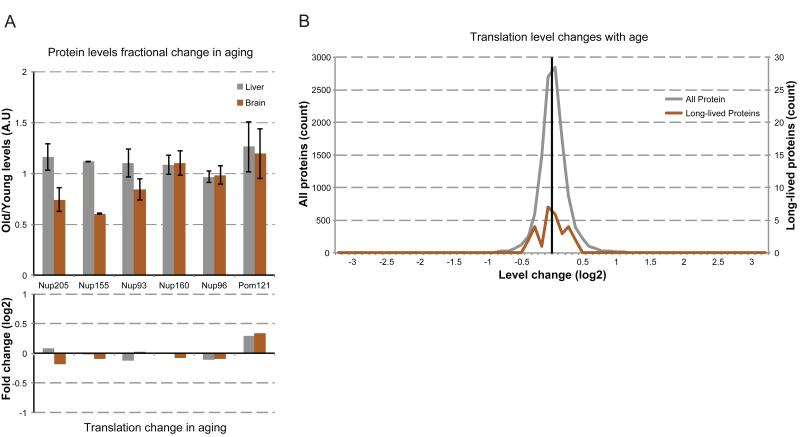
NPC composition changes with age. (A) NPC levels with age. Upper: NPCs were purified from brain (orange) and liver (grey) nuclei from rats at 6 (young) and 24 (old) months of age. Indicated Nup levels were determined by western blot, normalized to Nup107 levels. Plotted are the old levels normalized to the young levels. Lower: Translation levels of the indicated Nups from 6-month-old rat brains were compared to translation levels of 24-month-old rat brains, and plotted as old/young translation levels (log2 scale). (B) Changes in translation levels (old rate/young rate, log2 scale) were binned by log2 fold change (0.1 unit bins) and plotted as a histogram for all proteins (grey, >11,000 proteins, left vertical scale) and the identified long-lived proteins (orange, right vertical scale). See also Figure S5.

