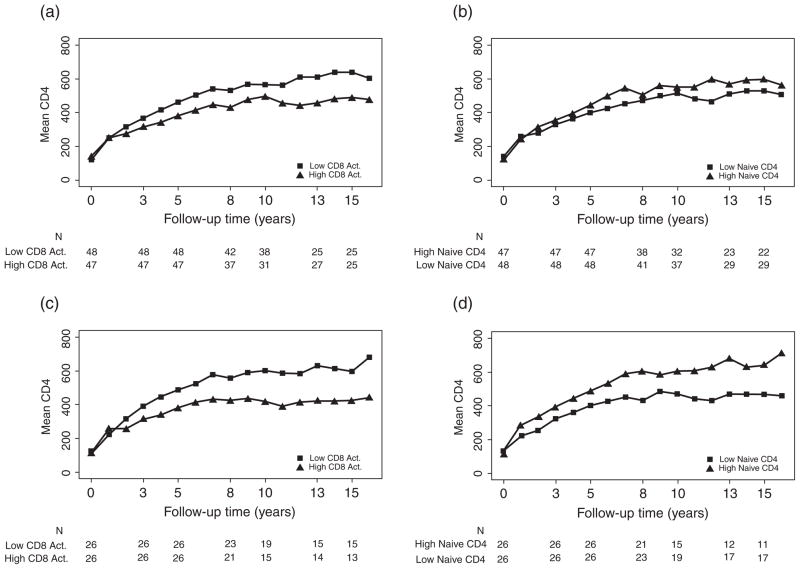
Figure 1.
Mean CD4+ T-cell counts over time in virally suppressed subjects, using 200 copies/mL virologic failure threshold for panels (a) and (b) and using a 50 copies/mL threshold for panels (c) and (d), stratifi ed by (a) high versus low (>18.5% vs ≤18.5%) CD8+ T-cell activation (% CD38+/HLA-DR), (b) high versus low (<32% vs ≤32%) naïve CD4+ T-cell perentage (% CD45RA+/CD62L+), (c) high versus low (>18.9% vs ≤18.9%) CD8+ T-cell activation (% CD38+/HLA-DR), (d) high versus low (>33% vs ≤33%) naïve CD4+ T-cell percentage (% CD45RA+/CD62L+). CD8+ T-cell activation and naïve CD4+ T-cell percentage were averaged levels measured primarily during years 3–5.

