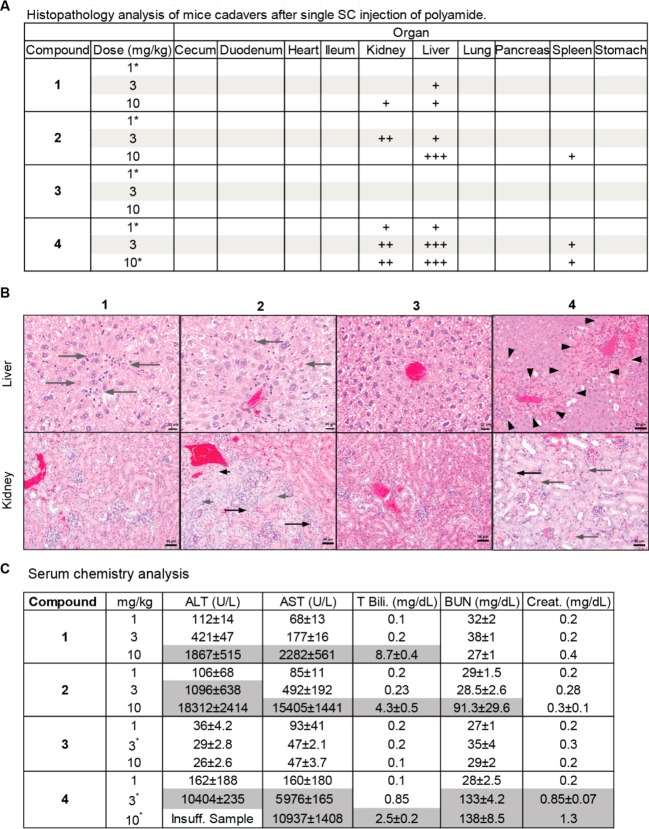
Figure 3.
(A) Histopathology analysis of sacrificed animals showed primary organ damage in the kidney and liver for compounds 1, 2, and 4. Animals treated with 3 did not exhibit signs of organ damage. * represents n = 1. + = mild damage, ++ = moderate damage, +++ = severe damage. (B) Liver and kidney histopathology of two representative animals treated with compounds 1–4 at 3 mg/kg. Liver: long gray arrow = hepatocellular apoptosis/necrosis, arrowheads = outline area of bridging hepatocellular necrosis/apoptosis. Kidney: short gray arrow = tubular epithelial karyomegaly, long gray arrow = tubular epithelial apoptosis/necrosis, short black arrow = tubular epithelial mitoses, long black arrow = tubular epithelial attenuation. (C) Serum levels of liver damage and kidney damage markers. Significantly elevated markers are shaded in gray. * represents n = 2.

