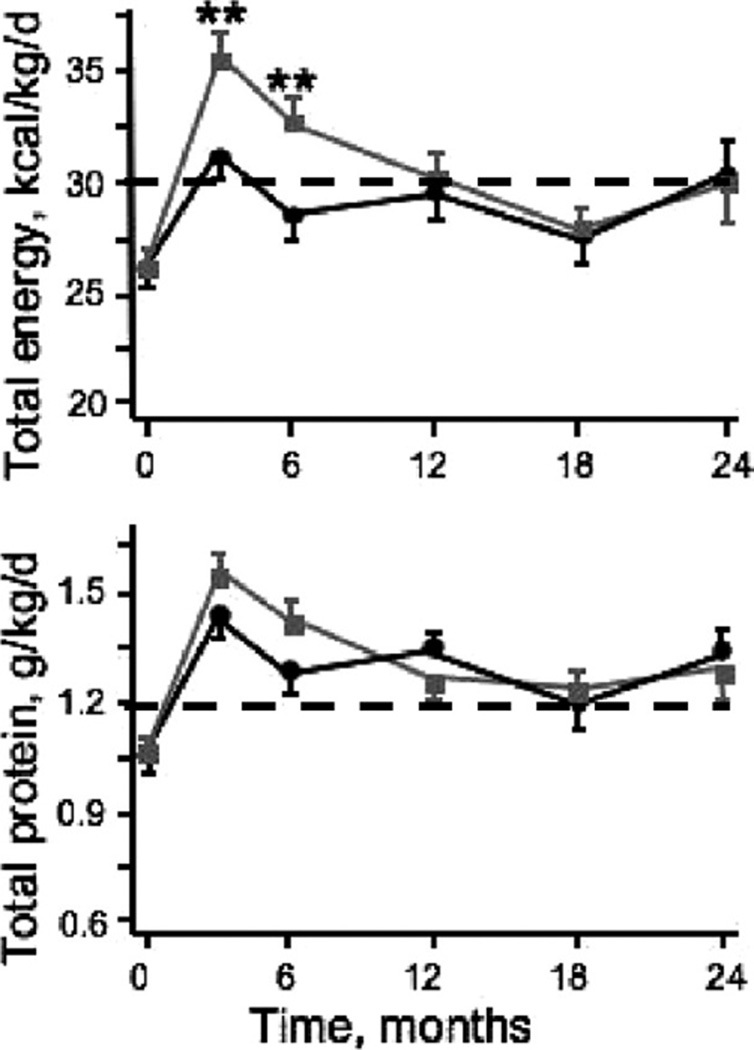
Figure 2.
Changes in total energy and protein intakes during the 2-year follow-up evaluation in control (black line) and IDPN (gray line) groups (means ± SEM) in the FINE study participants. Although there were between-group differences in energy intake at months 3 and 6 (P < .01), both groups achieved the minimum K/DOQI recommended thresholds for protein and energy intake in maintenance hemodialysis patients (dotted lines). In both groups, nutritional support induced comparable increases in serum albumin levels at months 3, 6, 12, and 18 (P < .01) and in serum prealbumin levels at months 3 to 24 (P < .02). Adapted with permission from American Society of Nephrology.24

