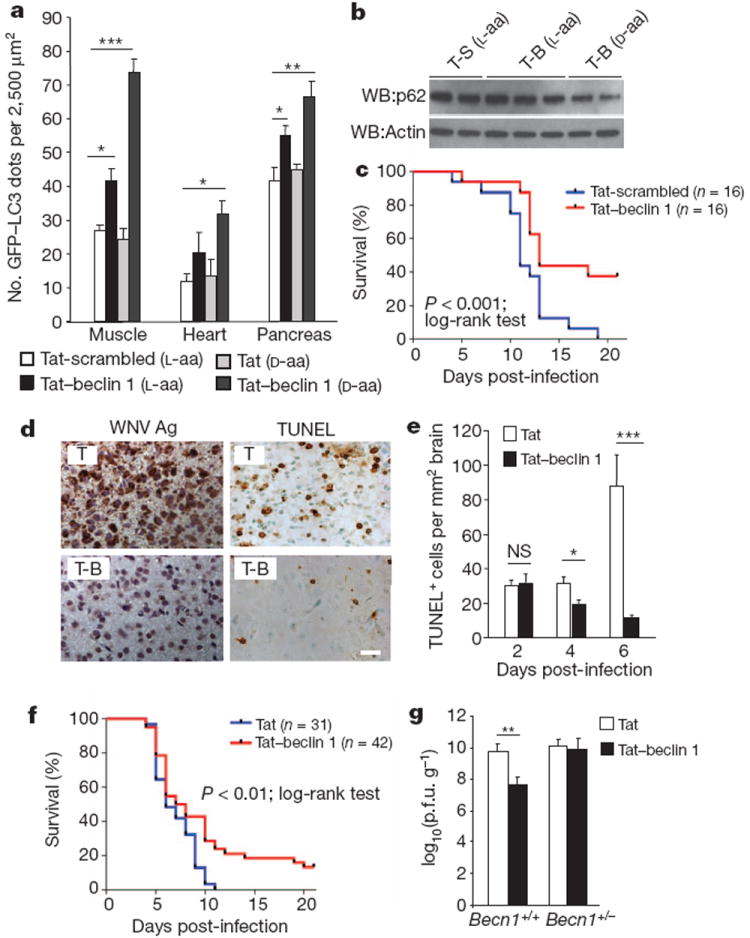
Figure 4. Tat–beclin 1 peptide induces autophagy and exerts antiviral activity in vivo.

a, GFP–LC3-positive dots in tissues of 6-week-old GFP–LC3 mice treated with the indicated peptide (20 mg kg−1 i.p., 6 h). A minimum of ten fields was counted per tissue section. Bars represent mean ± s.e.m. for three mice. Similar results were observed in three independent experiments. b, p62 immunoblot of brains of 5-day-old GFP–LC3 mice treated with the indicated peptide (20 mg kg−1 i.p., 6 h). c, Survival curves of 5-day-old C57BL/6J mice infected with CHIKV(106 p.f.u. s.c.) and treated daily with peptide (15 mg kg−1 i.p. beginning 1 day post-infection). d–f, Representative images of WNV envelope antigen and TdT-mediated dUTP nick end labelling (TUNEL) staining (d) (T, Tat alone), quantification of cell death in brain (e), and survival curves (f) for 5-day-old C57BL/6J mice infected with WNV (Egypt strain 101, 1 p.f.u. intracerebral (i.c.)) and treated daily with peptide (d-amino acid forms, 20 mg kg−1 i.p. beginning 1 day post-infection). Images in d are from cerebral cortex day 6 post-infection. Similar results were observed in all regions of the brain for three mice per group. Scale bar, 20 μm. Bars in e represent mean ± s.e.m. TUNEL-positive cells per unit area of brain for three mice. g, Geometric mean + s.e.m. viral titres of WNV-infected mouse brains day 6 post-infection. Values represent combined data for 12–20 mice per treatment group from 10 to 12 litters. Data in c and f represent combined survival probabilities for three and four independent litters, respectively, in each group. Similar results were observed in each independent experiment. *P < 0.05; **P < 0.01; ***P < 0.001; NS, not significant; t-test.
