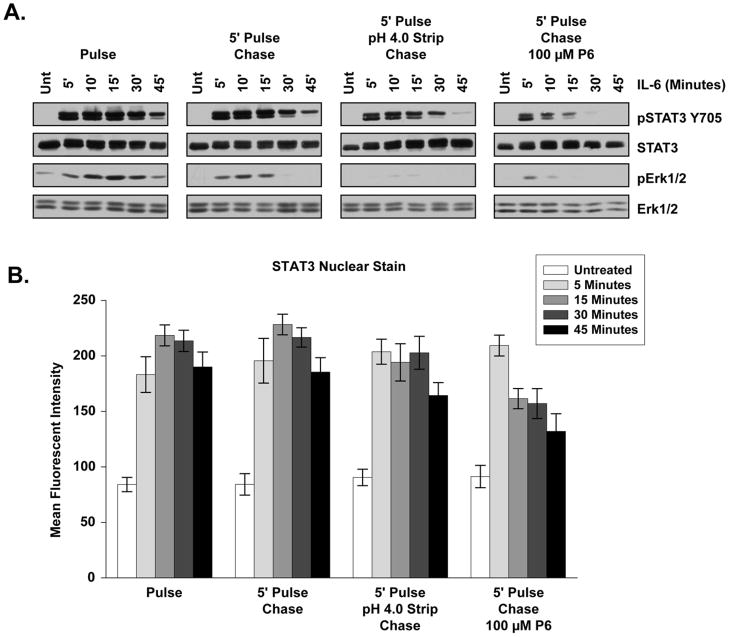
Figure 6. Persistent STAT3 Activation Arises from Endocytic Structures.
(A) STAT3 and Erk1/2 phosphorylation profile following pulse or pulse-chase 20 ng/mL IL-6 treatment as described in the Experimental Procedures and the Results sections. Blots shown are representative of results seen in at least three independent experiments. (B) Mean fluorescent intensity of STAT3 nuclear staining across a time course of 20 ng/mL IL-6 pulse and pulse-chase conditions. Error bars indicate 95% confidence intervals and significance is discussed within the Results section.

